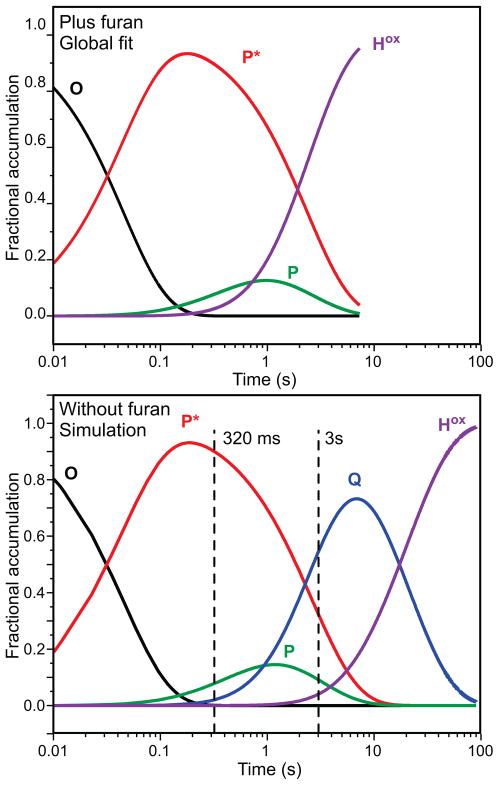
Figure 4.
Speciation plots based on the global fitting analysis to the spectra-kinetic data of the single turnover reaction of MMOH in the presence of H33A MMOB. Top: in the presence of furan. Bottom: in the absence of a substrate. The top plot shows time courses for each species obtained directly from a global fit of the spectra-kinetic data from 325 nm–685 nm collected over a 10 s interval. For the simulation in the bottom panel, a numerical integration method using the rate constants determined here and the previously determined value for the rate constant for Q decay when using MMOB H33A in the absence of substrate was used to compute the time courses shown.28 The dashed vertical lines indicate the times at which rapid freeze quench samples were obtained for Mössbauer spectroscopy. In both top and bottom panels, the fractional accumulation refers to the reactive fraction of MMOH.

