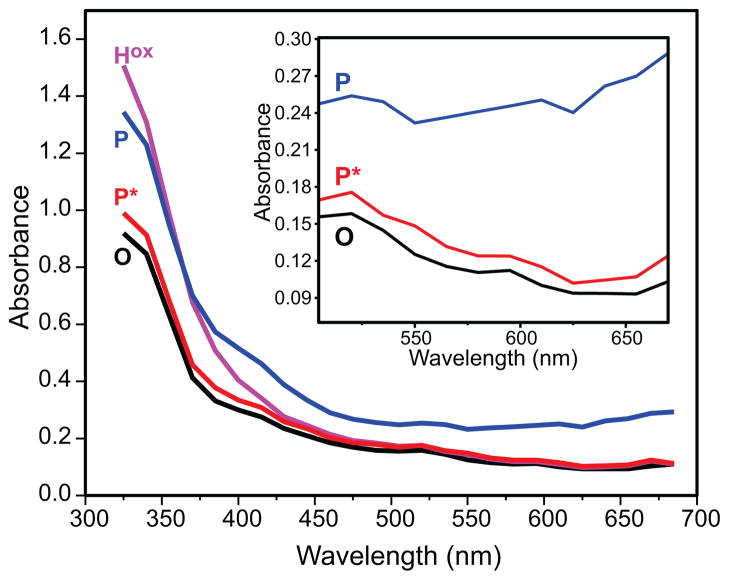
Figure 5.
The pure component spectra of compound P* (red) as obtained by global fitting of spectra-kinetic data compared to those of compound O/Hred (black) and Hox (magenta). The pure component spectrum of P (blue) (from a Hred single turnover reaction using WT-MMOB) has been overlaid for a comparison with P*. Experimental conditions as in Figure 3. Inset: Expanded spectra showing the difference in absorbance for intermediates P*, O, and P the long wavelength region.

