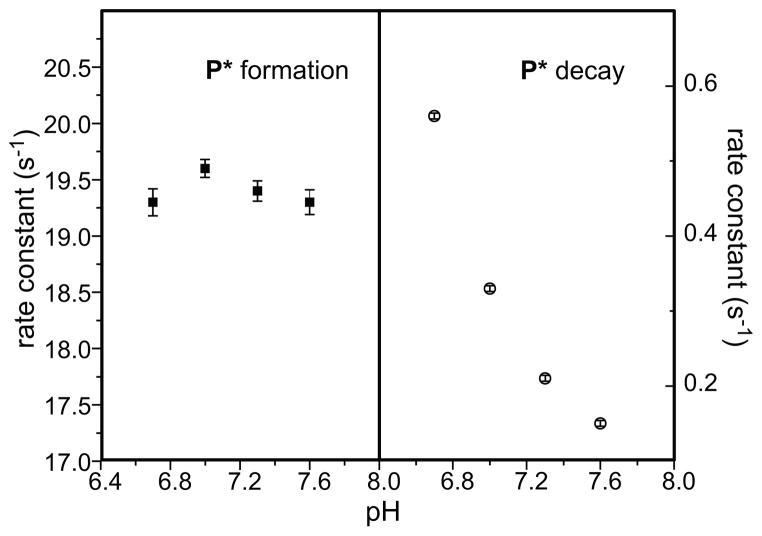
Figure 6.
pH dependence profile of the kinetic steps of P* formation and decay. The rate constants were obtained from a global fit of Hred single turnover reaction using H33A MMOB in the presence of furan at each pH point. The experimental error for the data in the right panel falls within the symbols used to indicate the data.

