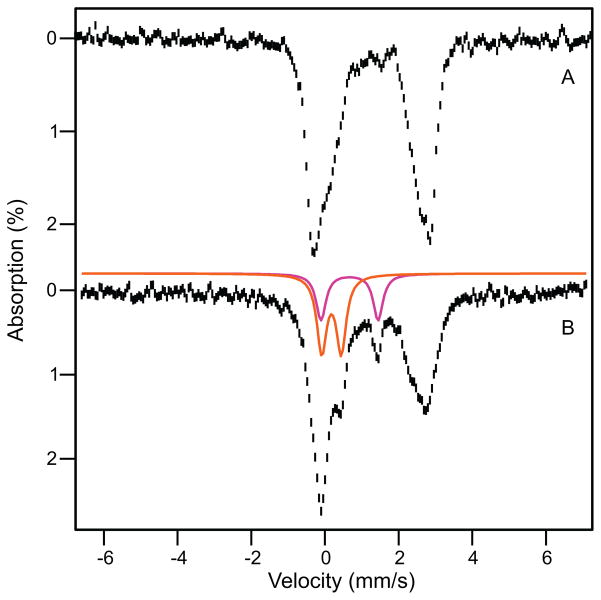
Figure 8.
4.2 K Mössbauer spectra of rapid freeze quenched samples of the Hred single turnover reaction at 320 ms. The reaction for spectrum A uses H33A MMOB while the reaction for spectrum B uses WT MMOB. Here spectrum A is the same as that shown in Figure 7B. Spectrum B exhibits considerable accumulation of intermediates P (15% of Fe, magenta) and Q (20%, orange).

