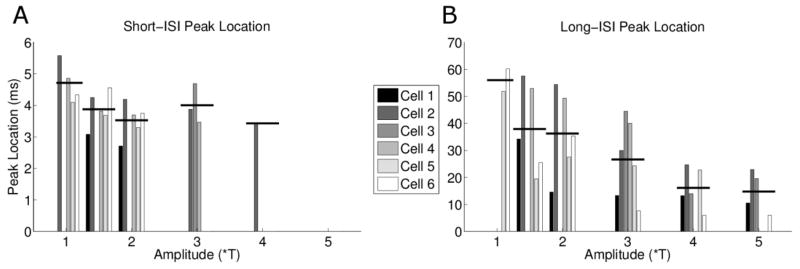
Figure 10.

ISI analysis of burst spiking in DS Cells. (A) Short-ISI peak location clustered by stimulus amplitude. Similar to Figure 7, each bar represents the center peak location of the Gaussian fit (see figure 6); horizontal bars represent the mean ISI at each amplitude level. (B) Same as (a), except for long-ISI peak locations.
