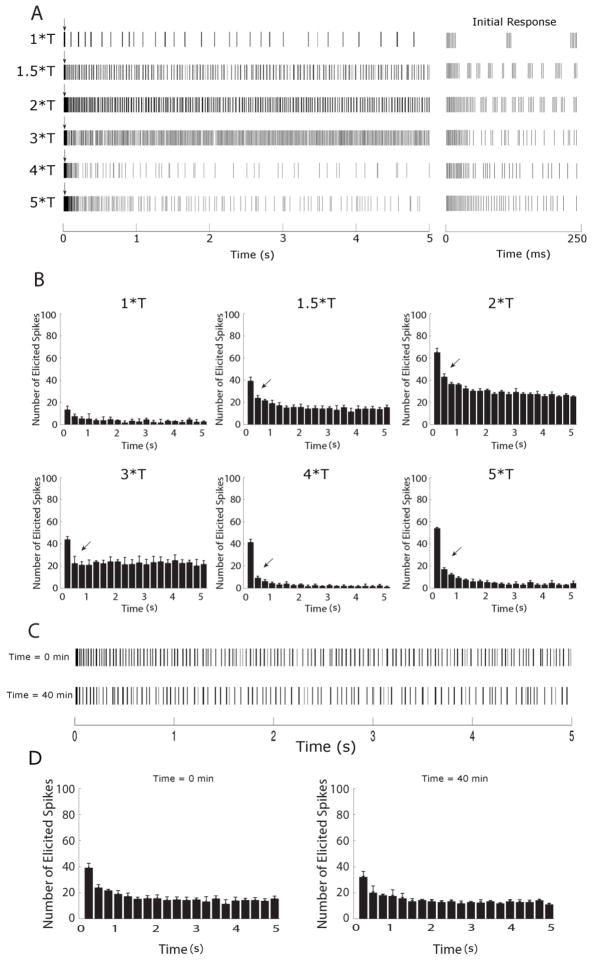
Figure 2.
Brisk-transient cells are sensitive to stimulus amplitude at 2000 PPS. (A) Spike rasters of the full 5 second response (left) and the initial 250 ms of the response, shown in expanded scale (right), of an OFF-BT cell to 2000 PPS stimulation at the amplitude levels indicated on left (T = 17 μA, see text); all responses are from the same cell. Each vertical line represents a single spike; bursts of spikes appear darker. A brief period of elevated spiking (arrows) was observed at the beginning of all trials. (B). Histograms of the spike trains in (A); Bin sizes were 250 ms and each histogram represents the average of 3 trials. (C) Response to 1.5*T pulse train at the beginning of an experiment (top) and the response to the identical stimulus 40 minutes later (bottom). (D) Histograms of the early and late responses in (C) reveal no significant differences between responses over time.

