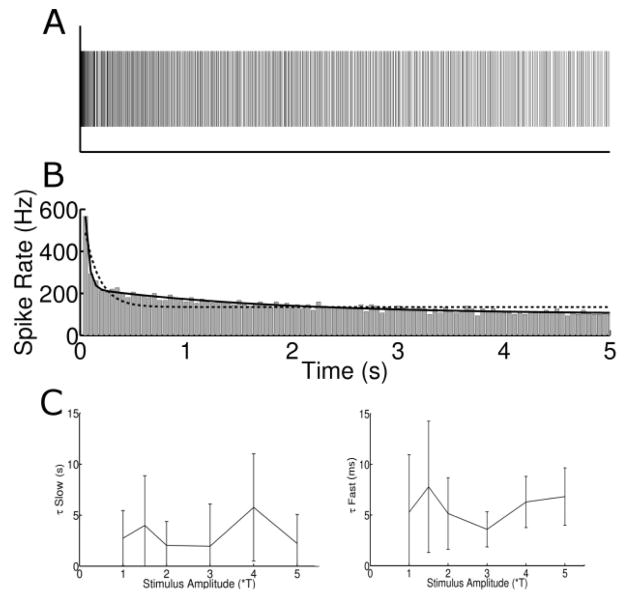
Figure 3.
Responses desensitize in two phases. (A) Typical spike raster to 3*T stimulus. (B) Histogram of the spike raster in (A). Bin size: 50 ms. Bin heights were fit with a single exponential curve (dotted line) as well as a double exponential (solid line). (C) The time constants for the slow (left) and the fast (right) component of the double exponential equation as a function of stimulus amplitude for all cells. Error bars represent ± SD

