Figure 5.
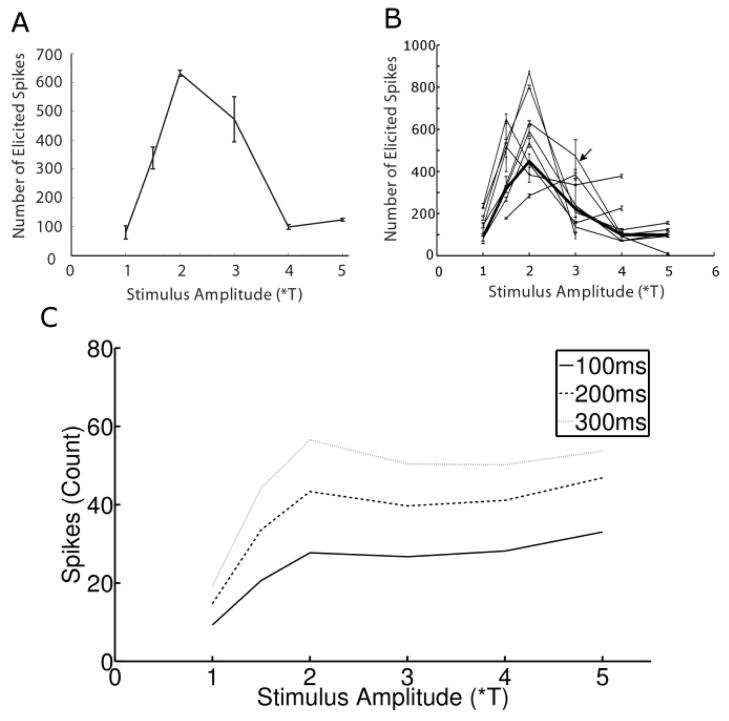
Response sensitivity to amplitude is bimodal. (A) Total number of elicited spikes as a function of stimulus amplitude for a typical OFF-BT cell. Each point is the average of three trials, and error bars show standard deviation. (B) Overlay of similar amplitude sensitivity plots for all cells; arrow indicates the cell in (A). Thick line: average of responses from all cells. (C) Spike counts were determined for time intervals following stimulus onset of 100ms (dark line), 200ms (dashed line) and 300ms (light line).

