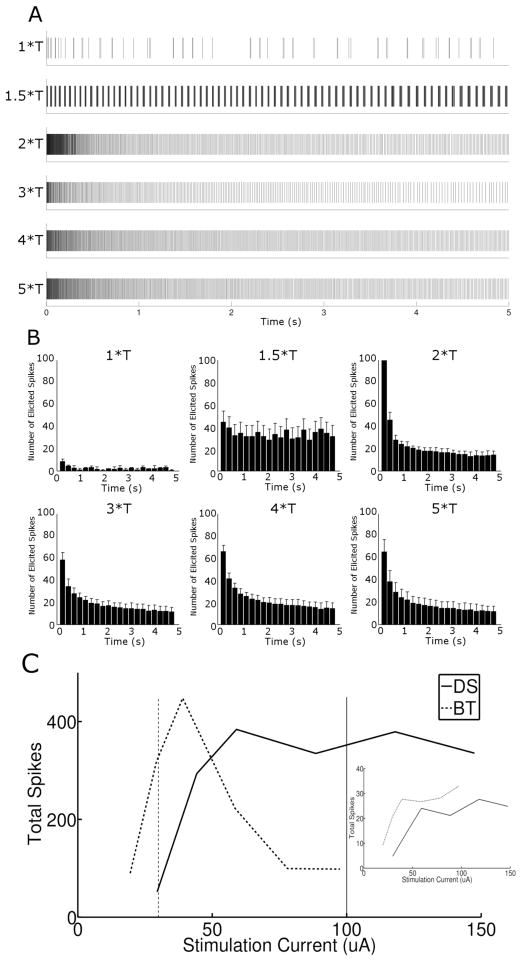
Figure 9.
Response of directional selective ganglion cells differs from OFF-BT responses. (A) Spike rasters of a single DS cell in response to stimulation at different amplitudes (levels indicated at left). (B) Histograms of spike trains in (A). Bin size was 250 ms, and each plot is the average of 3 trials. (C) Total number of spikes across 5 second trials averaged over all trials and all cells (DS N = 6, OFF-BT N = 9). Inset compares total spikes in the first 100ms (‘initial’ response) for DS and BT cells.

