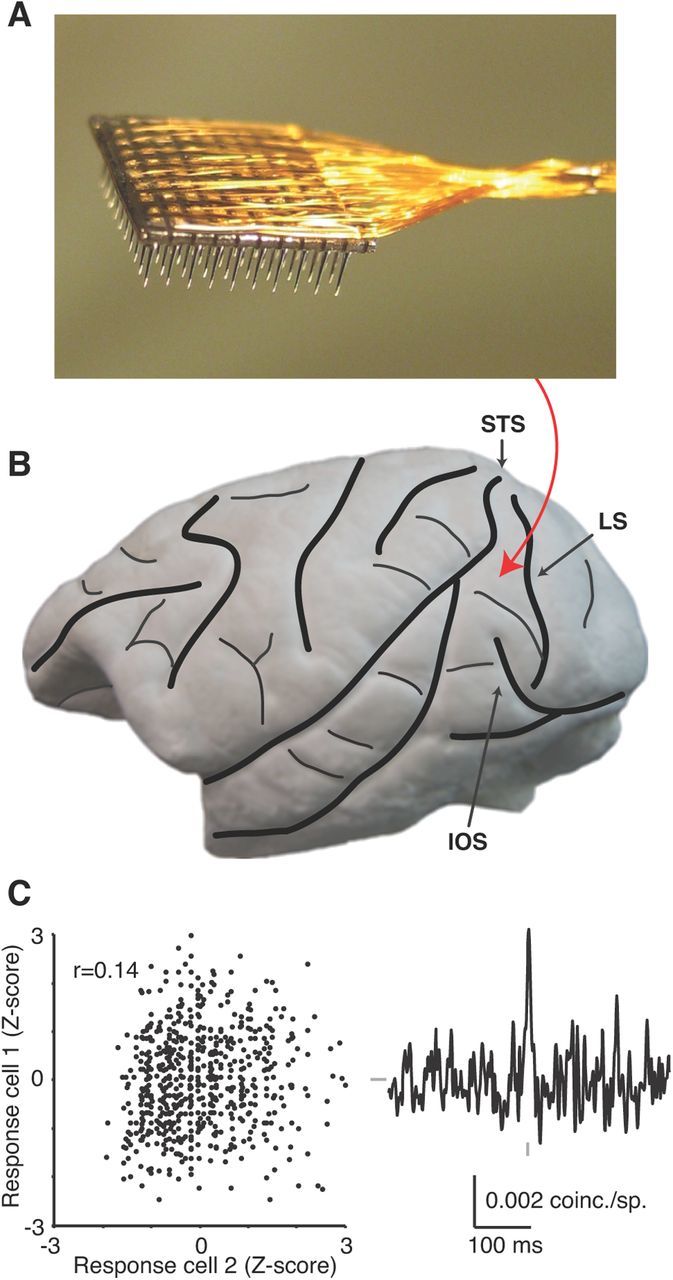
Figure 1.

Experimental methods. A, Photograph of the array, consisting of a 10 × 10 grid of silicone microelectrodes with 400 μm spacing and 1.0 mm length. B, Lateral view of the macaque brain with major sulci indicated with thick black lines and minor vessels and sulci with thin black lines. The rough position of the inserted arrays, anterior to the lunate sulcus (LS), posterior to the superior temporal sulcus (STS), and medial/dorsal to the inferior occipital sulcus (IOS), is indicated with the red arrow. C, For a single pair of V4 neurons, the plot on the left shows the z-scored spike counts of one neuron on all of the trials (of all 12 stimuli) plotted as a function of the same metric in a second neuron. The Pearson's correlation of these data points was 0.14 (p < 0.0001). For the same pair of neurons, the jitter-corrected CCG is shown (with a jitter window of 50 ms). The vertical gray tick represents zero time lag and the horizontal gray tick represents 0 coinc./sp. Scale bars are shown below the CCG.
