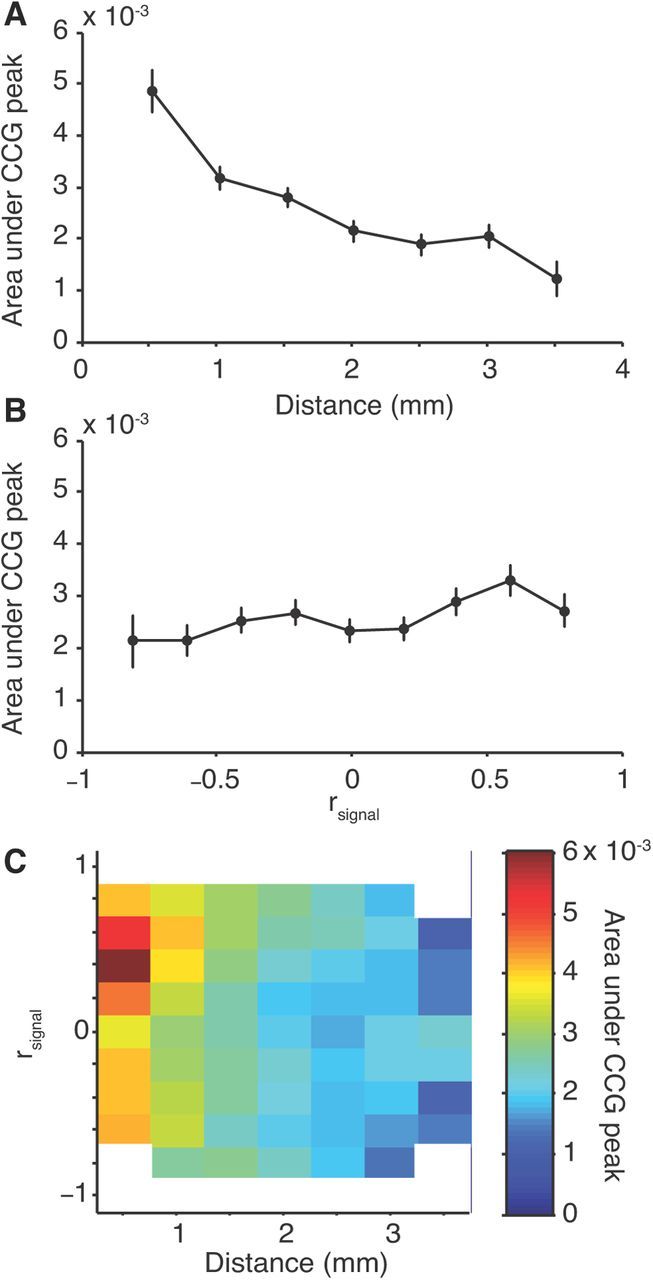
Figure 5.

Influence of distance and tuning similarity on synchrony. A, Synchrony, as measured by the average area under the CCG within 10 ms of the zero time lag bin as a function of the distance between neurons. B, Synchrony as a function of tuning similarity (rsignal). C, Dependence of synchrony on both distance and tuning similarity shown as a surface plot. Bins containing <10 pairs are removed (indicated with white). The bar at the right of the panel indicates the scale.
