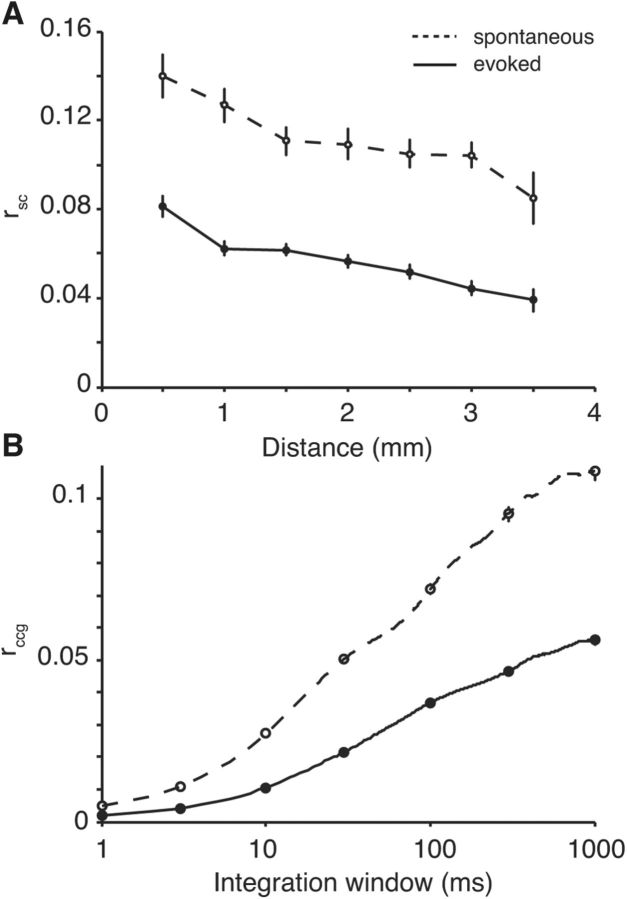
Figure 7.
Differences between spontaneous and evoked activity. A, Correlated variability (rsc) as a function of the distance between neurons for spontaneous (dashed line) and evoked (solid line) activity. B, Time scale of correlation is shown here for the same neurons, with a plot of rccg as a function of integration window.

