
Fig. 1.
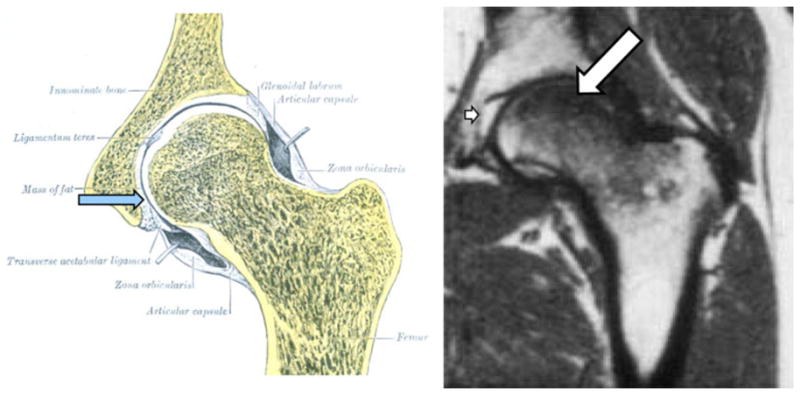
MRI of osteonecrosis. The acetabular fat pad (blue arrow) shown in the left panel gives an intense white signal with MRI as shown in the right panel (small arrow), while the loss of marrow fat (large arrow) gives a dark signal typical of edema with T1 MRI imaging