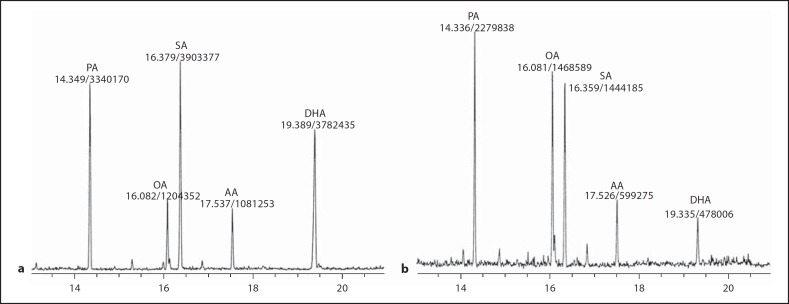
Fig. 1.
Representative chromatograms of retinal fatty acids in normal (a) and diabetic (b) mice. Peaks were identified on the basis of their retention time as well as their mass spectra, with reference to the corresponding standards. The amount of fatty acid present in each peak, represented by the peak area, was calculated on the basis of peak areas obtained by injecting known amounts of standards.

