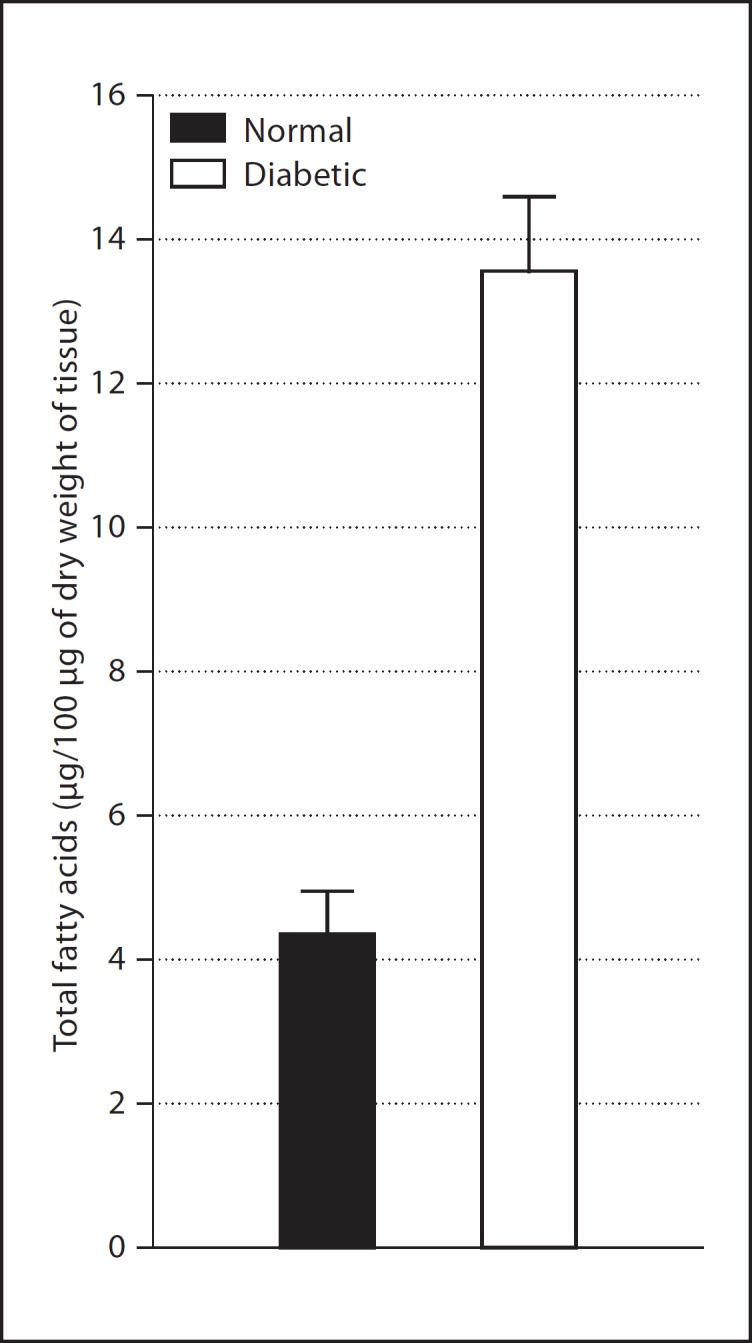
Fig. 2.

Total fatty acid content of the retina. The values are expressed as mean ± SD; n (number of retinas) ≥ 8 in each group. The total amount of fatty acids was calculated by adding the amounts of the individual fatty acids and then expressing it in terms of micrograms per 100 μg of dry weight of the tissue. p < 0.001 between the normal and diabetic groups [29]
