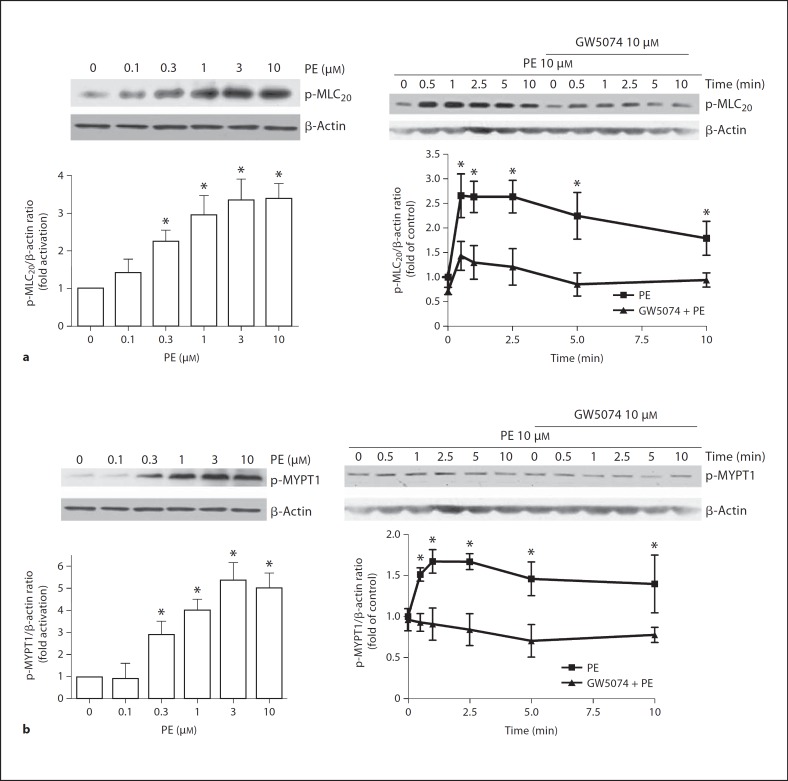
Fig. 6.
Effects of Raf-1 kinase inhibition on PE-induced MLC20 (a) and MYPT1 (b) phosphorylation in rat VSMCs. Left and right panels show concentration- and time-dependent effects of PE, respectively. Cultured cells were pretreated with vehicle or GW5074 (10 μM) for 30 min before stimulated with 10 μM PE. Treated cells were processed as described in Methods. The phosphorylation levels of MLC20 or MYPT1 were determined by immunoblotting. Top panels show representative blots of phospho-MLC20 or phospho-MYPT1 and β-actin, bottom panels are the summary of densitometric results. Results were normalized against β-actin and expressed as folds change relative to control. Data represent means of 3–5 independent experiments. * p < 0.05 compared with their respective time point in the presence of GW5074.

