
Figure 2. Box plot showing the effect of VKORC1 Asp36Tyr polymorphism on warfarin dose requirements in Egyptians.
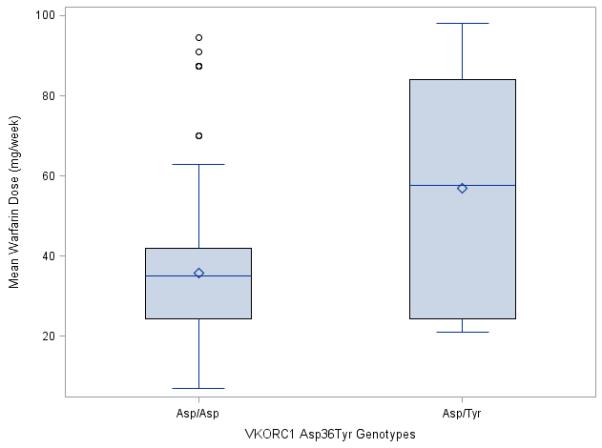
The box represents the values from the 25 to 75% percentile. The horizontal line represents the median. The diamond represents the mean. The vertical line extends from the minimum to the maximum value, excluding outlier and extreme values which are marked as closed circles. Nonparametric test (Mann-Whitney U test) was used to compare the warfarin dose requirements between the two groups, showing a significant difference of P = 0.03.