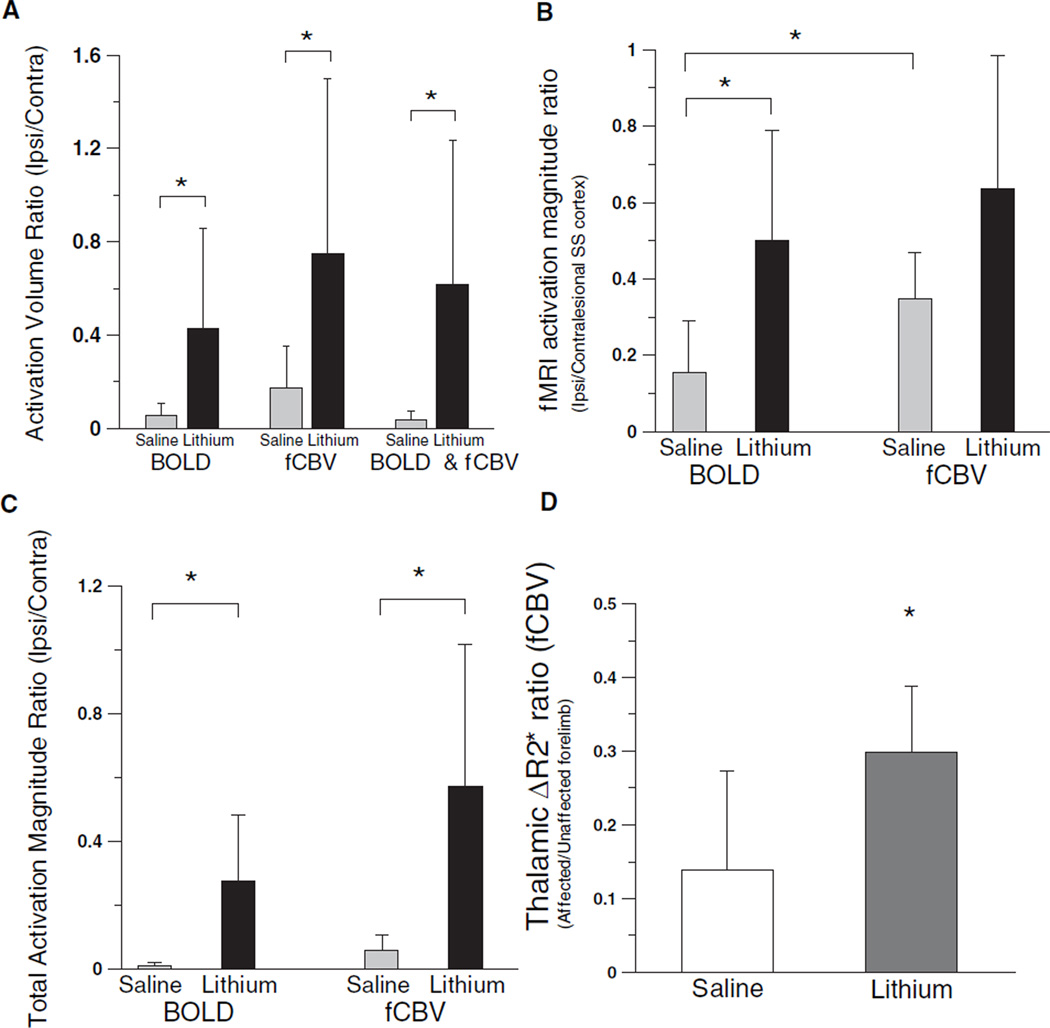
Figure 2.
Ratios between contralesional and ipsilesional hemispheres activated volumes, in which a voxel is considered activated with a threshold of P<0.0001 (A), activation signal ratio between ipsi-/contralesional cortices (B), total activation magnitude ratio between ipsilesional and contralesional SS cortices (C), and thalamic fCBV activation amplitude ratio acquired from the entire thalamus between affected and unaffected forelimbs (D) for the lithium-treated (n=6) and saline-treated (n=6) rats (*P<0.05).

