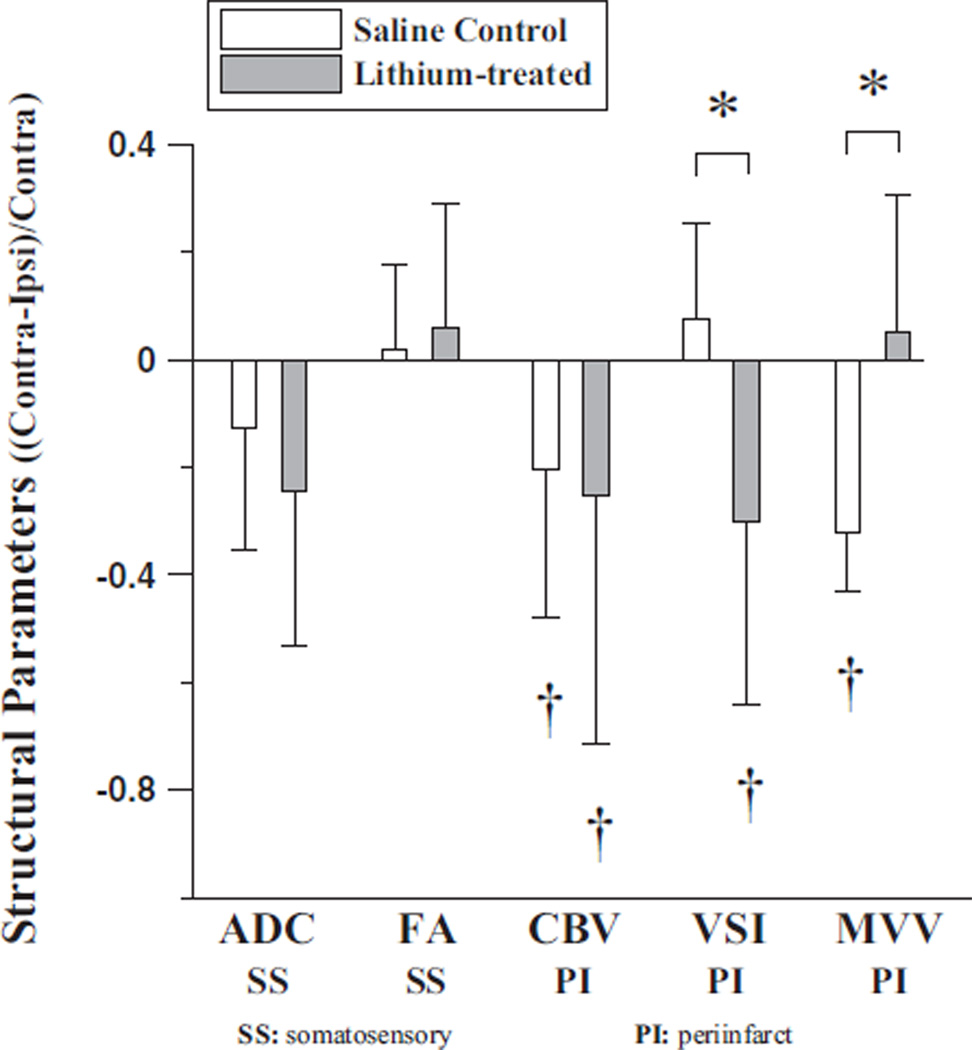
Figure 4.
>MRI-derived structural parameters of saline control (n=6) and lithium-treated rats (n=6) (*P<0.05). For ADC and FA analyses, ROIs were chosen over somatosensory cortex and for CBV, VSI, and, MVV; the ROIs were chosen over the periinfarct area (≈0.2 mm of the lesion border defined from T2-weighted images). †P<0.05 significantly different from zero.

