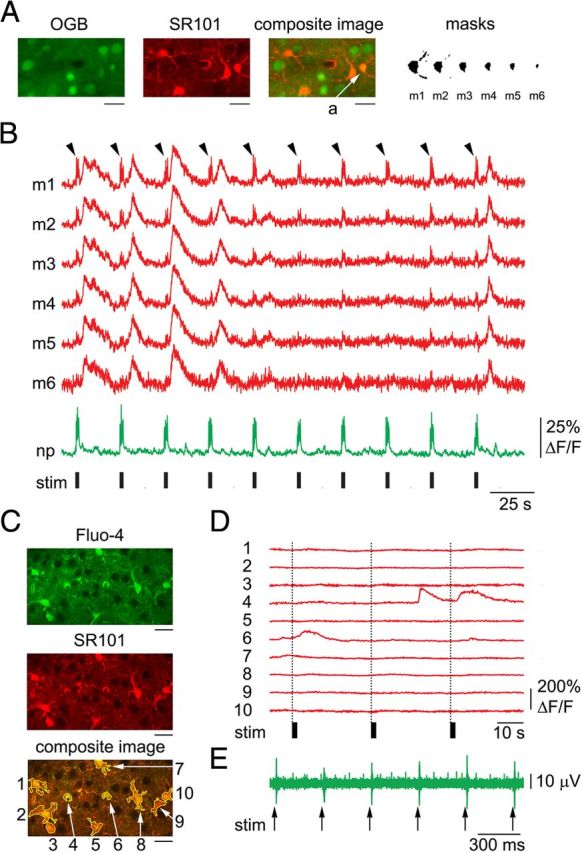
Figure 1.

Cross talk between astrocytic and neuropil calcium signals during stimulus-induced response. A, Reduction of cross talk with neuropil signals through shrinking (“erosion”) of astrocytic ROI in OGB1-stained cortex. An example FOV including a number of astrocytes labeled with SR101/OGB1 and a number of neuronal cell bodies labeled with OGB1, imaged 190 μm below the cortical surface. Scale bar, 20 μm. A gradual erosion of a single-cell ROI (astrocytic cell body labeled “a”) is illustrated on the right: Starting from a mask defined by a liberal thresholding of SR101 intensity (m1) and eroding a single layer of pixels at a time (m2-6). The masks are enlarged relative to the composite image for viewing purposes. B, Time courses extracted from the masks shown in A. All time courses are baseline-subtracted and peak-normalized to illustrate that the erosion procedure selectively decreases contamination from neuropil (black arrowheads) while preserving the slow and large-amplitude “true” astrocytic signal. Calcium signal change in neuropil (i.e., outside neuronal and astrocytic cell bodies), expressed as ΔF/F, is shown in green. The black bars indicate stimulus duration. C, An example FOV labeled with Fluo-4 and SR101, imaged 180 μm below the cortical surface. The yellow color of the composite image indicates colocalization of Fluo-4 (green) and SR101 (red) in astrocytes. Scale bars, 30 μm. D, Calcium signal time courses, expressed as ΔF/F, extracted from the ROIs outlined in the composite image in C. The black bars indicate stimulus duration. E, An example nonrectified MUA voltage trace illustrating responses to six consecutive stimuli within a single stimulus trial. MUA recordings were performed simultaneously with optical acquisition to ensure neuronal response to stimulation.
