
Figure 3.
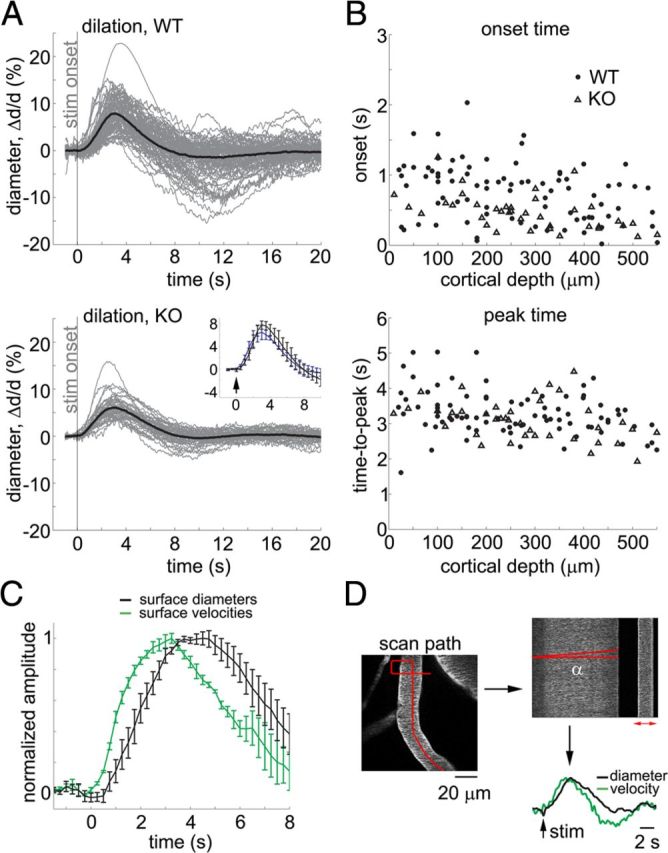
IP3R2-KO mice exhibit normal functional hyperemia. A, Time courses of arteriolar diameter change in WT and IP3R2-KO subjects (top and bottom panels, respectively). All measurements for each category are overlaid. The average is superimposed on each panel (thick lines). The stimulus onset is indicated by the gray vertical line. The across-subject averages are superimposed in the inset to facilitate temporal comparison; the error bars indicate a 95% confidence interval for the mean. B, Onset (top) and time-to-peak (bottom) for all measured arteriolar diameter changes in WT (solid dots) and IP3R2-KO (open triangles) subjects, extracted from the data in A. Data from all subjects are overlaid and presented as a function of the cortical depth. C, Comparison of paired diameter and velocity measurements from surface arterioles. Cross-subject averages for diameter (black) and velocity (green) time courses. First, we averaged all time courses acquired within a subject. Then, averaged time courses were normalized by the peak amplitude before calculating the average across subjects; the error bars indicate SE across subjects. An increase in velocity preceded an increase in diameter (p < 0.01). This behavior is consistent with a theoretical expectation from a distributed vascular network when the fastest dilation occurs in deep cortical layers (Boas et al., 2008). D, An example illustrating simultaneous measurements of diameter and velocity. On the left, a scan path is superimposed in red on an FITC image of a surface arteriole. A segment of the scan path along the vessel is used to estimate velocity based on the angle of streaks in temporally stacked lines denoted by α at the top right (see Materials and Methods) (Kleinfeld et al., 1998). A segment of the scan path across the vessel is used to compute dilation based on expansion of the profile (the red arrow at the top right). Corresponding diameter (black) and velocity (green) time courses are shown at the bottom right.