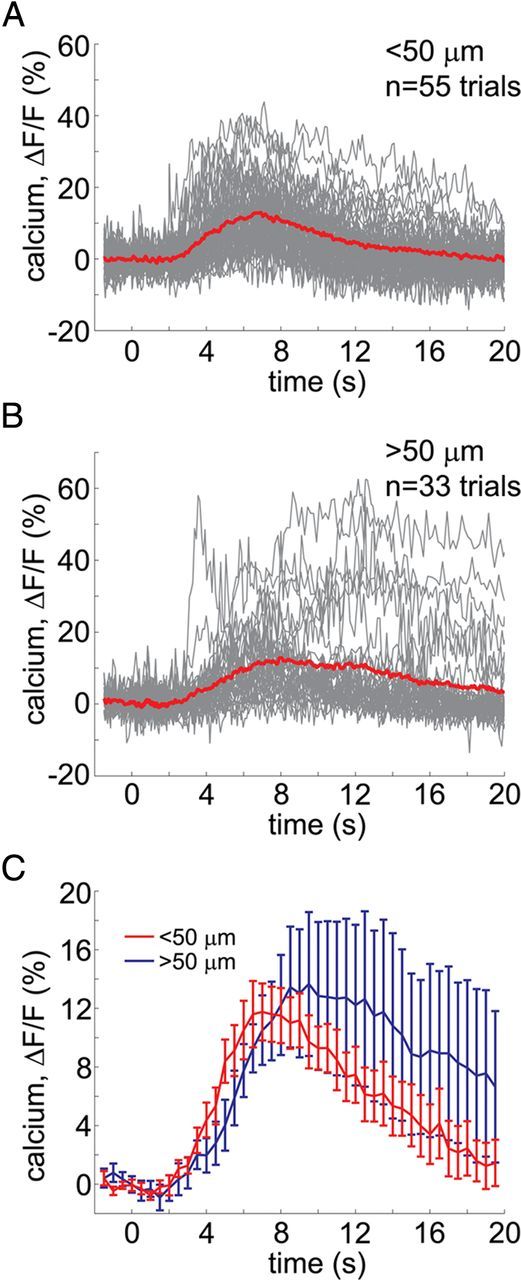
Figure 6.

Astrocytic response kinetics as a function of the distance from arterioles. A, B, Overlaid time courses of all trials with significant astrocytic signal change, pooled across subjects, sorted by distance from diving arterioles: within (A) and outside (B) a 50 μm radius. C, Statistical comparison of astrocytic response kinetics for the two distance categories across subjects: <50 μm (red) and >50 μm (blue). The curves show across-subject averages; the error bars indicate SE.
