Figure 9.
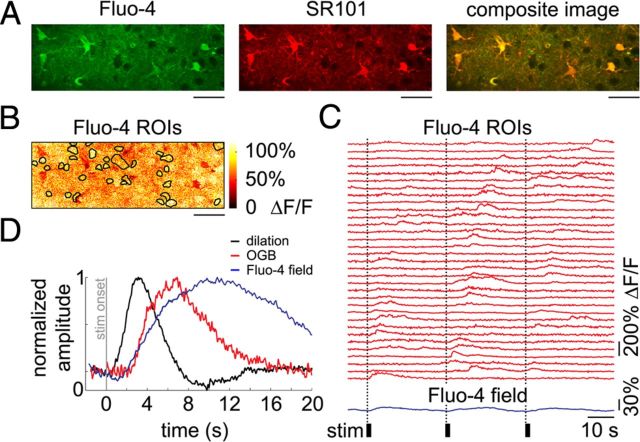
Calcium increase in fine astrocytic arborizations lags behind dilation onset. A, An example FOV labeled with Fluo-4 and SR101, imaged 200 μm below the cortical surface. B, Subcellular ROIs overlaid on an MIP image of Fluo-4 ratio images. The MIP image was calculated for the time series of 3 stimulus trials. Individual ROIs were defined by thresholding MIP images calculated for individual stimulus trials. Scale bars: in A, B, 50 μm. C, Calcium signal time courses extracted from ROIs shown in B (red traces) and from the entire FOV (“Fluo-4 field,” blue trace). The black bars indicate stimulus duration. D, Averaged Fluo-4 field response. Averaged dilation time course and calcium response from astrocytic cell body ROIs from the same depth category (≤200 μm) are superimposed in black and red, respectively. All curves are normalized to the maximum amplitude.

