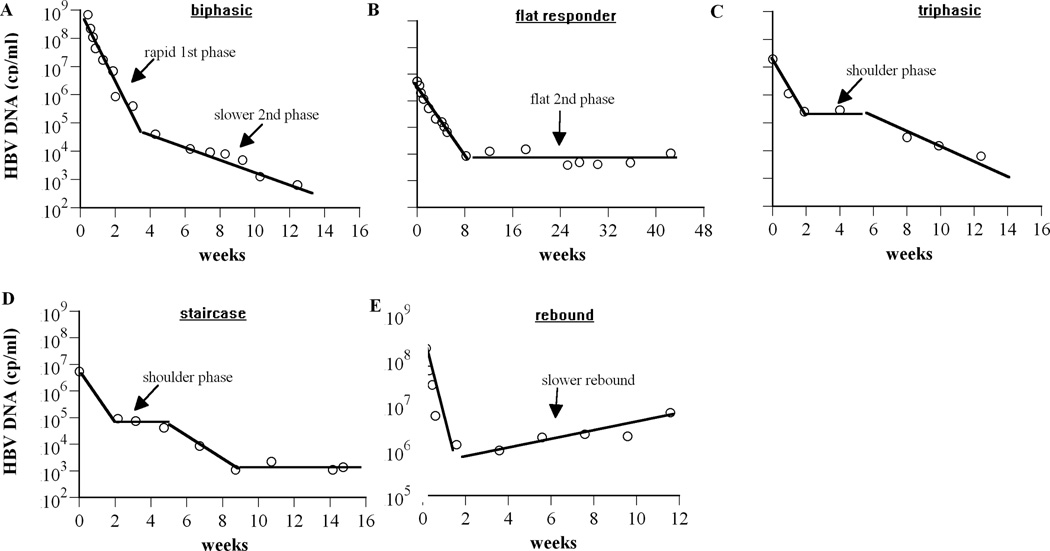
Figure 1.
Complex HBV DNA decline profiles observed in patients during drug therapy. (A) Biphasic decay (patient 16 from Lewin et al. (2), treated with lamivudine and famciclovir), (B) flat 2nd phase (patient 8472 digitized from Colombatto et al. (19); patient was treated with pegylated intereferon-α2a), (C) triphasic decay (Figure 2B digitized from Tsiang et al. (11); patient was treated with adefovir dipivoxil), (D) staircase decay (patient 6 from Lewin et al. (2), treated with lamivudine and famciclovir), and (E) slow rebound (patient 10 from Lewin et al. (2), treated with lamivudine). Experimental data are represented by open circles. Solid lines were used to emphasize plausible phases of viral decay.

