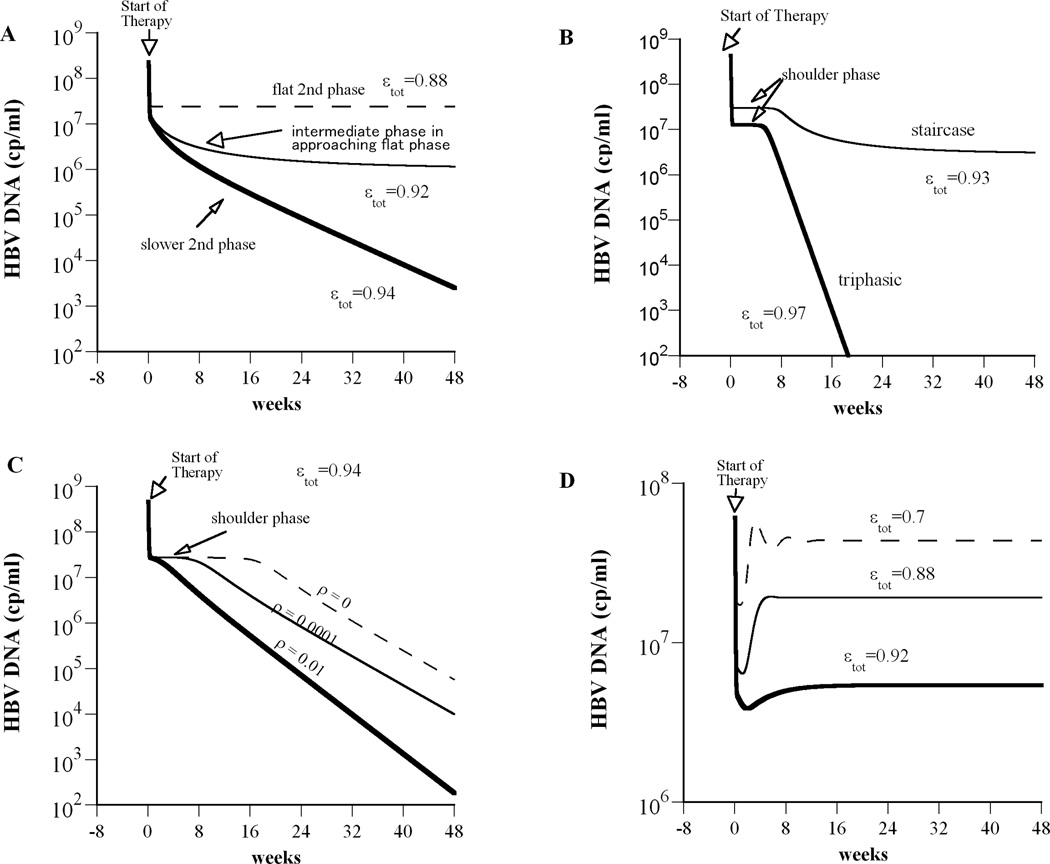
Figure 2.
Model simulations predict complex HBV DNA decline profiles during drug therapy. We solved our model (Eq. 1) numerically using Berkeley-Madonna (version 7.0.2; http://www.berkeleymadonna.com). (A) A flat second phase occurs when εtot<εc (dashed line; here εtot=0.88; εc=0.934). When εtot is close to εc (but still εtot < εc), then after the rapid viral decay phase an intermediate slower phase is predicted that approaches a flat final phase (thin solid line; εtot=0.92). When εtot > εc we obtain a biphasic viral decline (thick line; εtot=0.94). (B) If we decrease the ratio of the target cell to the infected cell replication rate from rT/rI = 8.5 (used in (A)) to rT/rI= 2, a shoulder phase emerges. Staircase and triphasic viral decay profiles are represented by thin and thick solid lines, respectively. For the staircase profile total drug efficacy, εtot=0.93, is lower than the critical drug efficacy, εc=0.934 and therefore after the third phase of viral decay the viral load stabilizes in a steady state until end of treatment. For the triphasic profile εtot> εc (εtot=0.97) and thus viral will continue to decline under therapy. (C) If we increase the rate constant for cure of infected cells, ρ, from 0 (i.e., no cure) to 0.01 day−1, the shoulder phase of the triphasic decline disappears and we obtain a biphasic viral decline. Here εtot=0.94 and rT/rI = 1.25. (D) Viral rebound during treatment occurs when the hepatocyte replication rate is low, rT=0.51 day−1, rT/rI = 2 and εtot< εc (η=0). Except as noted, model parameters used were: Tmax = 1.9×10⁷ cells ml−1, dT = 0.004 day−1, p = 92.3 virions cell−1 day−1, β= 7.1×10⁻⁹ ml day−1 virions−1, c = 3.5 day−1, δ= 0.25 day−1, ρ=0 day−1, rT= 3.0 day−1, rT/rI = 8.5, η=0.5 and s= 1 cell ml−1 day−1.

