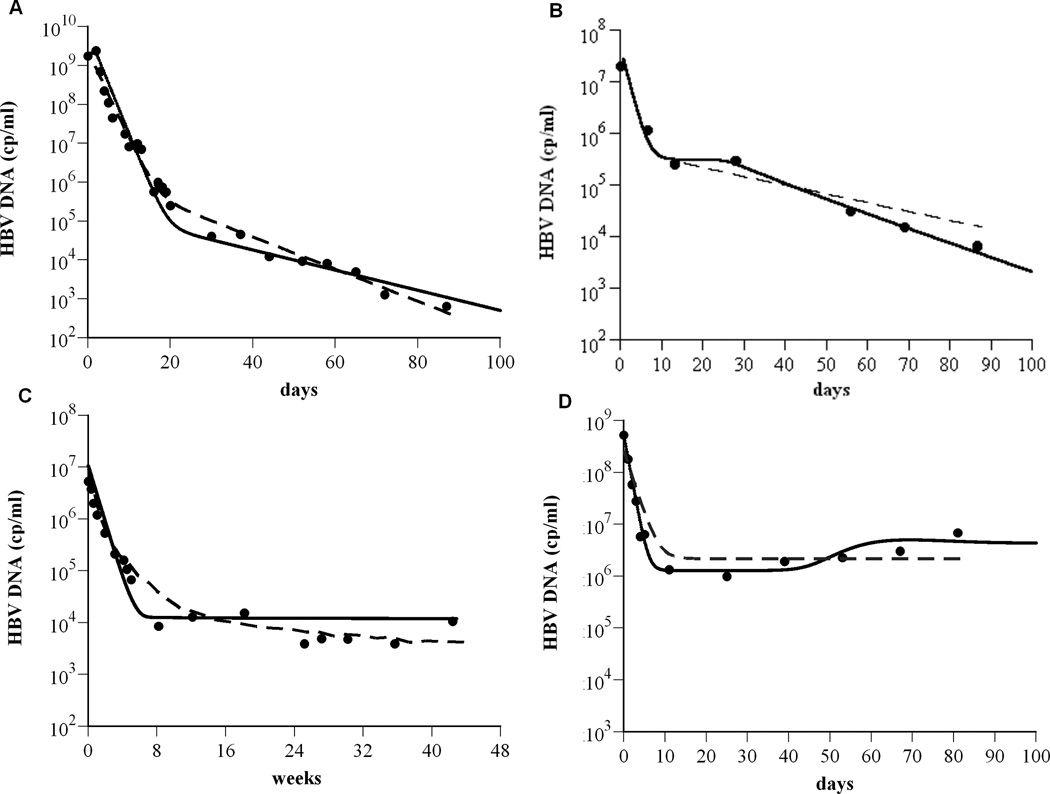
Figure 3.
The model is consistent with experimental data. To show that the model (Eq. 1) agrees with experimental data (as shown in Fig. 1), exhibiting biphasic (A), triphasic (B), flat 2nd phase (C) viral decays, and slow viral rebound (D), the solution for V(t) from Eq. (1) was compared (solid lines) to the HBV DNA (●) using Berkeley-Madonna (version 7.0.2; http://www.berkeleymadonna.com/). For the theoretical curves, we fixed Tmax = 1.9×10⁷ cells ml−1; ρ=0 day−1; s = 1 cell day−1 ml−1. The other parameter values used to generate the theoretical curves in panels (A) to (D), respectively, are: dT = 0.2×10⁻³, 2.7×10⁻³, 5.3×10⁻³, and 9.0×10⁻⁴ day−1; δ= 0.07, 0.22, 0.25, and 0.06 day−1; β= 1×10⁻¹⁰, 2.5×10⁻⁷, 1.9×10⁻⁶, and 6.6×10⁻⁸ ml virions−1 day−1; rT = 3.0, 0.9, 0.8, and 0.5 day−1; rT : rI = 5.0, 3.3, 2.9, and 7.2; c = 0.6, 0.7, 0.18, and 1.0 day−1; p = 87, 5, 1.4, and 164 virions cell−1 day−1; ε= 0.999934, 0.991, 0.9988, and 0.997; η=0.5, 0.5, 0.2, and 0.5; ε c = 0.75, 0.994, 0.99908, and 0.9987. Previous model predictions (dashed lines) for (A) and (D) were calculated from (2) and for (B) and (C) were digitized from (11) and (19), respectively.

