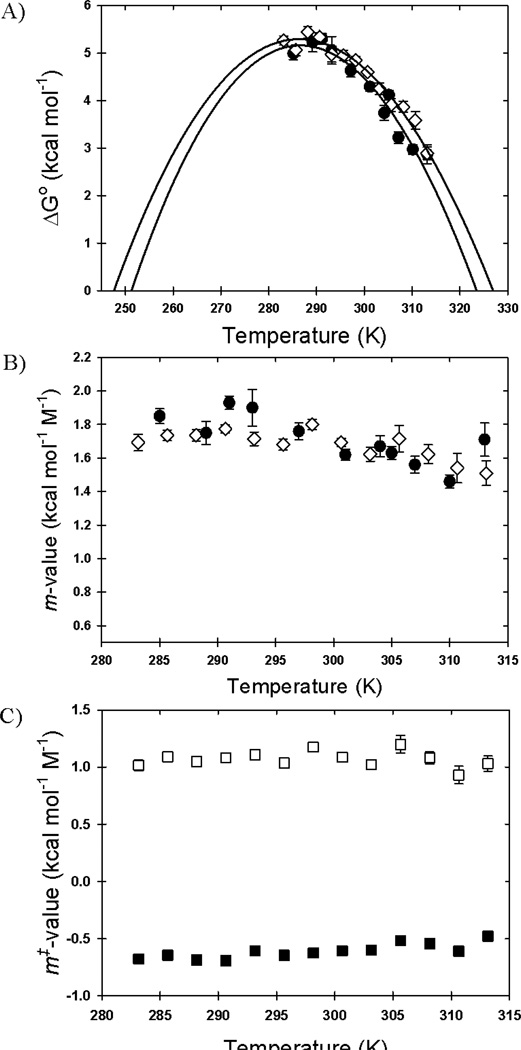
Figure 2. Temperature dependence of the ΔG0, m-values and m‡-values.
A) The free energy of folding in the absence of denaturant and B) the m-values of folding are shown as a function of temperature as derived from kinetic (open diamonds) and equilibrium (filled circles) experiments. C) The refolding (open squares), and unfolding (filled squares) kinetic m‡-values are shown as a function of temperature. The error bars represent the standard deviation of the fit. The solid linesin panel A represent the best fit to the Gibbs-Helmholtz equation (Equation 1).

