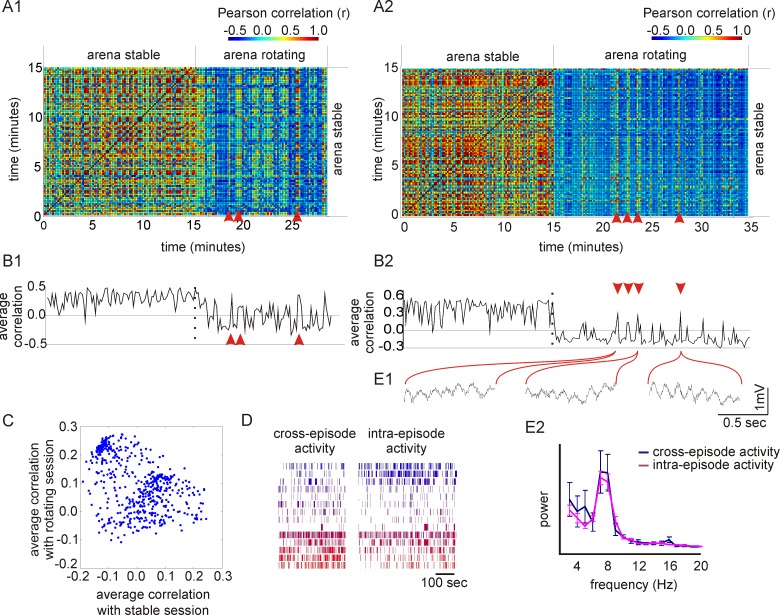
Figure 2. Cross-episode retrieval of ensemble activity.
(A) Ensemble activity during different 10-s intervals during the stable and rotating conditions was compared. Two different recordings are shown in panels A1 and A2. Different 10-s intervals during the stable condition tend to have high correlation. Intervals during the rotating condition are often dissimilar to the intervals during the stable condition. However, some 10-s intervals recorded during rotation are highly correlated with activity during the stable condition, as indicated by the reddish stripes (red arrowheads). These are intervals of cross-episode retrieval during which the ensemble activity pattern spontaneously switched to the pattern that was characteristic of the stable condition. (B) Average correlation of each 10-s interval with activity during the stable condition. Intervals during rotation typically have low correlation with activity from the stable condition. However, at intervals of cross-episode retrieval, by definition, the correlation is high, indicating that the ensemble activity pattern was similar to the stable condition. Plots B1 and B2 correspond to the sessions shown in A1 and A2, respectively. (C) The average correlation with activity during the stable condition and the average correlation with activity during rotation, for each 1-s interval of a recording during the rotation condition. The activity organizes into two clusters, representing two ensemble states: cross-episode intervals and intra-episode intervals. (D) Raster plots of activity of the ensemble of 15 cells during the rotating condition, divided into the intervals of cross-episode and intra-episode activity. (E) (E1) Examples of 1-s intervals of hippocampal LFPs from the rotating condition during intervals of cross-episode retrieval of activity that was characteristic of the stable condition. (E2) The average power-spectra of the LFPs during periods of cross-episode activity (blue) and intra-episode activity (magenta). Both activity patterns were expressed during prominent theta oscillations. The analysis of the complete data sets from the recording in plot B2 is shown.

