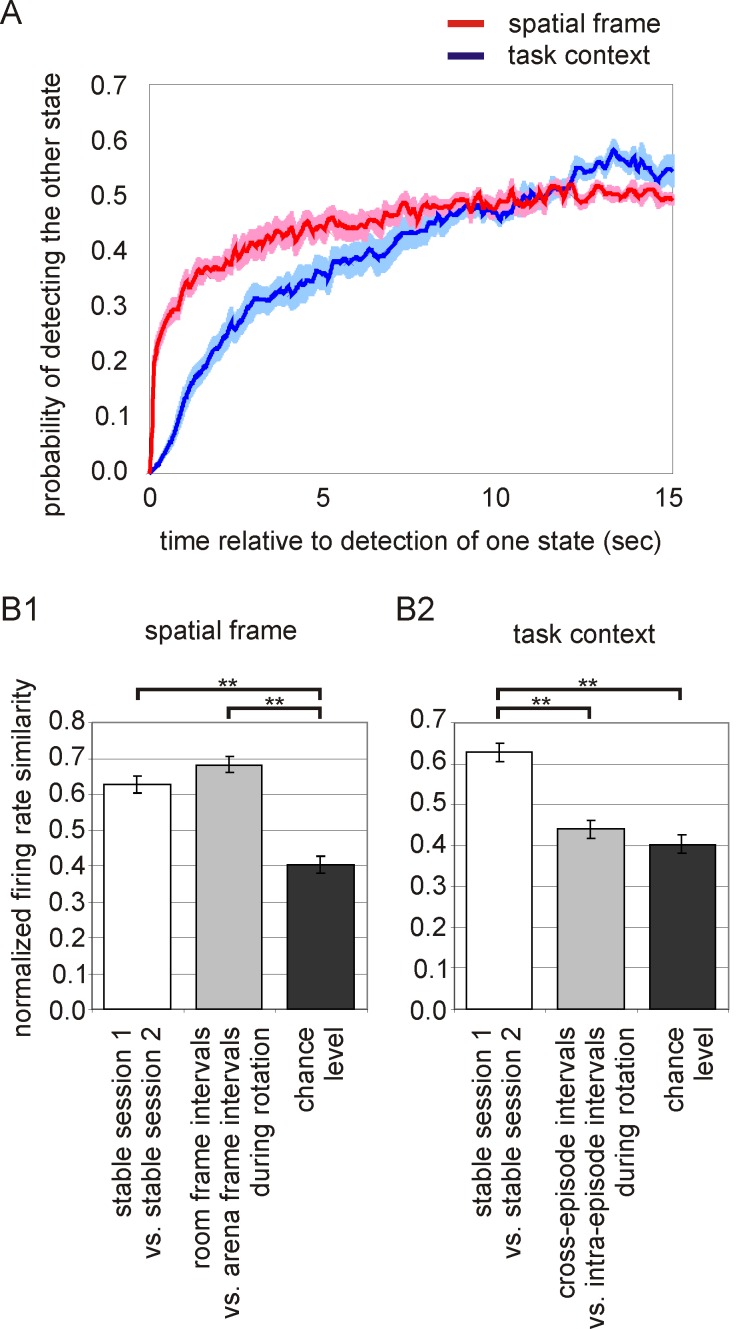
Figure 5. Organization of hippocampal ensemble activity according to two distinct categories of spatial information.
(A) Cross-correlation plots indicating probability of the code for spatial frame-specific position (red) and the code for task variant (blue) to switch to representing the other value. The code for spatial frame: Time 0 marks that activity was preferentially signaling position in either the room or the rotating arena. The y-axis shows the probability of preferentially signaling position in the other frame within the time interval indicated on the x-axis. The probability of observing activity that represents position in the other frame remains low for approximately 7 s when it reaches a plateau. The code for task variant: Time 0 is the time that cross-episode or intra-episode activity was preferentially expressed, and the y-axis shows the probability of the other activity pattern being expressed. The probability of observing the other pattern remains low for about twice as long as is the case for the spatial frame code, before reaching a plateau. Thus the code for task variant predicts activity further into the future than the code for spatial frame. (B1) The firing rate similarity between room frame intervals and arena frame intervals was high. The similarity was indistinguishable from the similarity of firing rates during two stable sessions in the same environment, and it was greater than is expected by chance. (B2) The firing rate similarity between cross-episode intervals and intra-episode intervals was low. The similarity was not higher than would be expected by chance.

