
Figure 2. Venn diagram showing significant gene expression changes 12 h E2, TAM, P4 or RU486 treatment, relative to non-treated Ishikawa cells.
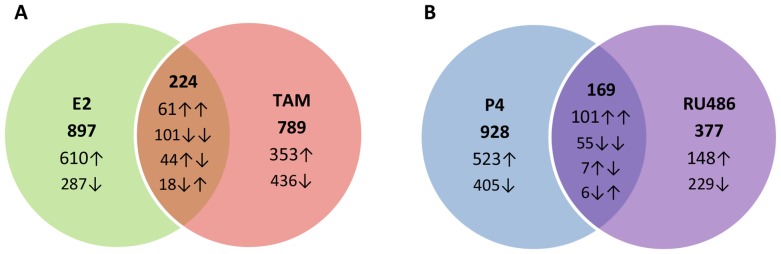
A Unique and common genes after 12 h E2 and TAM treatment. B Unique and common genes after 12 h P4 and RU486 treatment. The numbers given within each of the circles represent the number of significantly changed genes unique to treatment, and arrows show the manner they are regulated (up- or down-regulation compared to non-treated Ishikawa cells). Overlaps indicate the number of commonly changed genes.