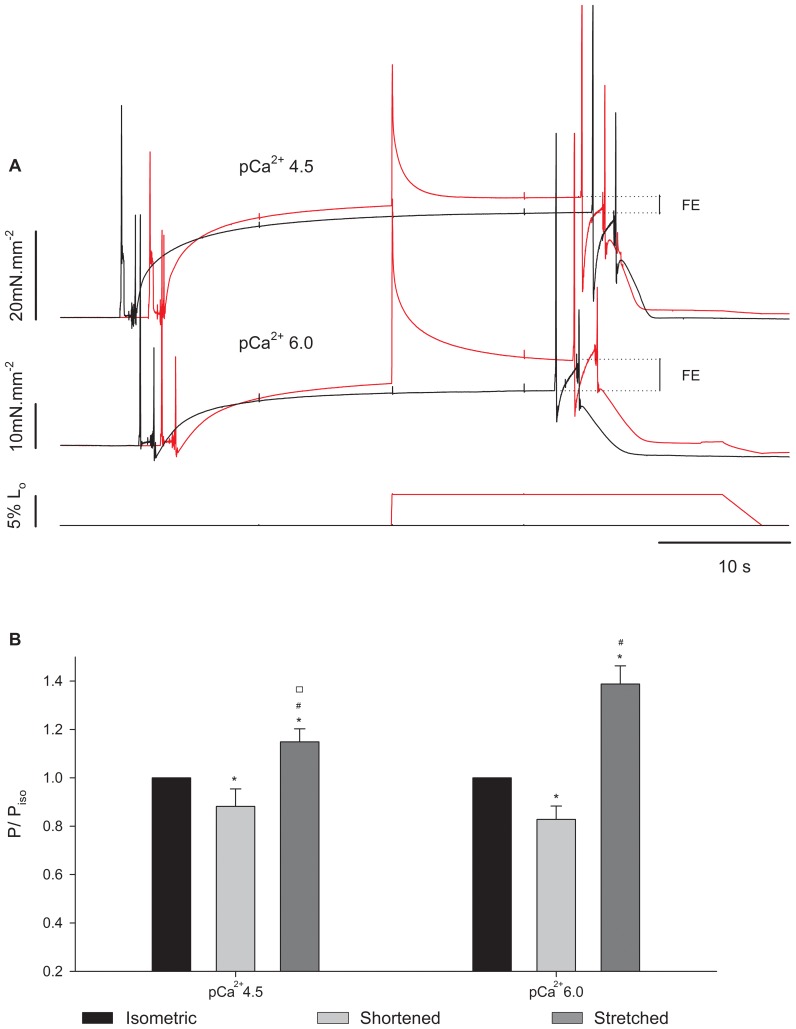
Figure 8. Residual force changes in different Ca2+ concentrations.
(A) Sample records from a typical experiment showing superimposed contractions produced by a fibre activated in pCa2+4.5 and pCa2+6.0. Black: isometric contraction at SL of 2.8 µm. Red: isometric contraction at SL of 2.65 µm followed by a 5% stretch. The corresponding length changes are shown in the lower panels. (B) Mean (± S.E.M.) relative forces from fibres activated in pCa2+4.5 and pCa2+6.0 (n = 13) in three conditions: isometric (black bar), shortened (light grey bar) and stretched (dark grey bar). P = forces recorded 10 s after length changes; Piso = force at the respective isometric condition. * significantly different from isometric, # significantly different from shortening, □ significantly different from the same condition (shortened) in pCa2+6.0.

