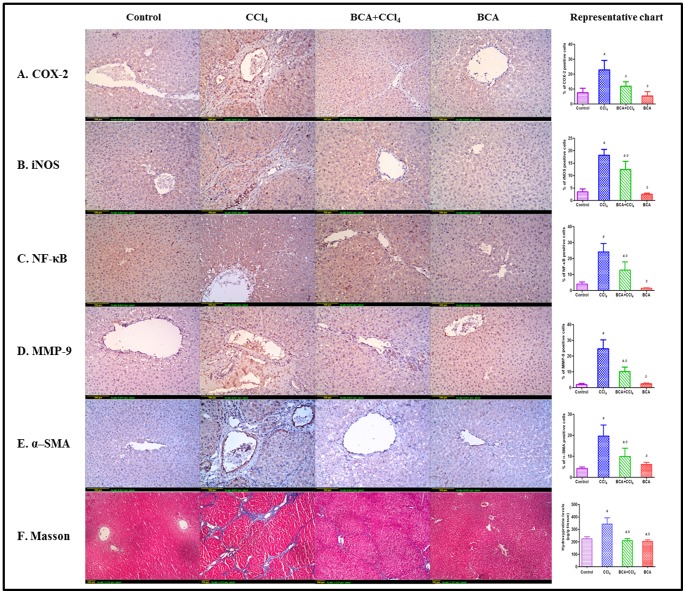
Figure 3. Representative images of liver sections of different experiments.
(A–E): Immunohistochemical detection of COX-2, iNOS, NF-κB, MMP-9 and α-SMA (x100). Control gp: minimal expression; CCl4 gp: extensive expression; BCA+CCl4 gp: less than CCl4 gp; BCA gp: minimal expression. Image analysis was performed by examining 6 fields/slide. (F): Masson trichrome stain (x40). Control gp: shows absence of collagen fibers (stained blue) between hepatic lobules; CCl4 gp: extensive fibers deposition with pseudolobules formation (bridging fibrosis); BCA+CCl4 gp: less fibers than CCl4 gp; BCA gp: absence of fibers. The bar chart represents levels of hydroxyproline expressed as µg/gm of wet tissue measured by Reddy’s method. a: significantly different from control gp. b: significantly different from CCl4 gp.

