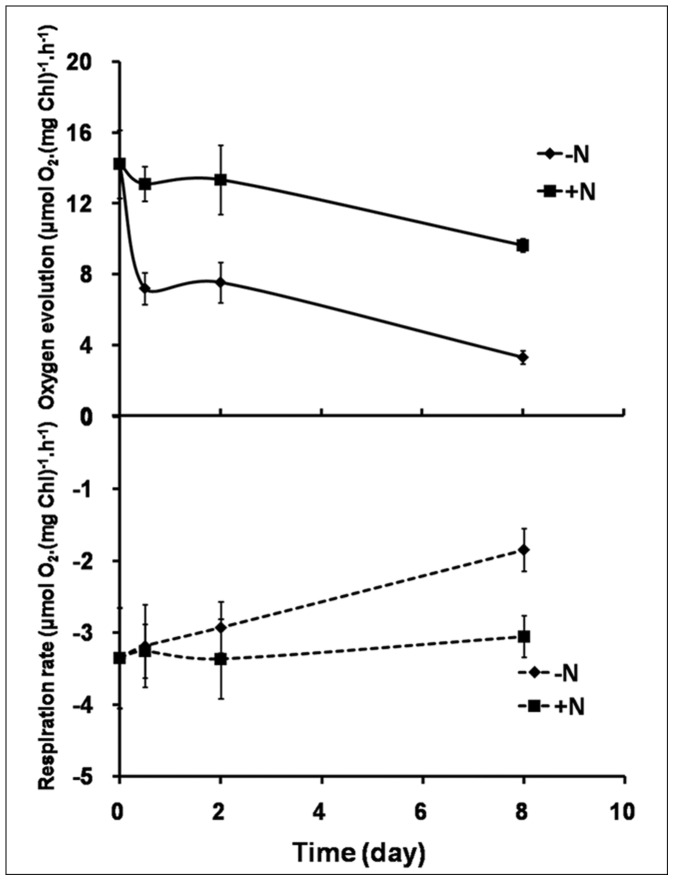
Figure 4. Variations in steady-state oxygen evolution and dark respiration in C. sorokiniana C3 during OD formation.
Solid line, oxygen evolution. Dotted line, respiration rate. Black square symbols, cells resuspended in N+ medium. Solid up arrow symbols, cells resuspended in N− medium. Values are means ± SD (n = 3). When error bars cannot be seen, error is less than the size of the symbol.

