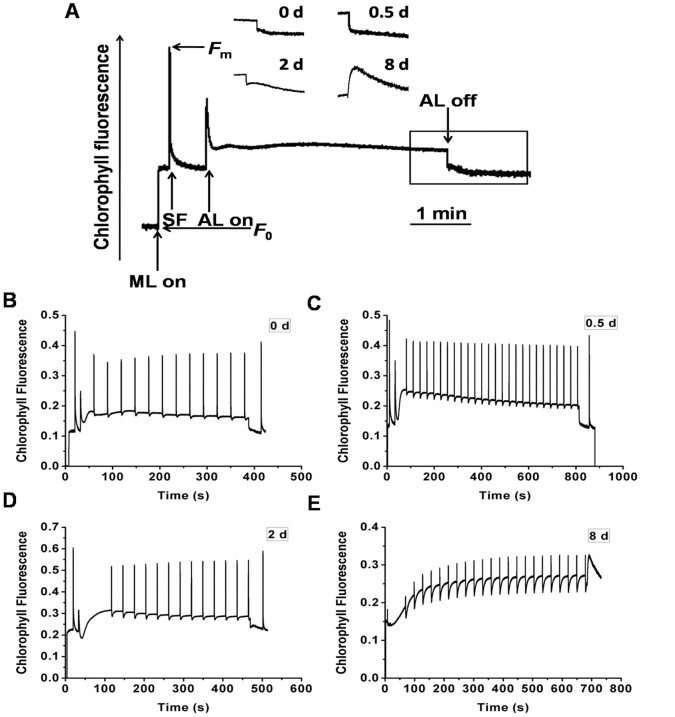
Figure 6. Characterization of Chl fluorescence in C. sorokiniana C3 during OD formation.
A, Transient post-illumination increase in Chl fluorescence. ML, modulating light beam. SF, saturating flash of white light. The curve shows a typical trace of Chl fluorescence in the cells on 0 d. Cells were exposed to actinic light (AL) (70 µE) for 5 min. AL was turned off and the subsequent change in Chl fluorescence level was monitored. Chl fluorescence image was captured at the times indicated by the scale bar. After switching the AL off, transient increases in Chl fluorescence were recorded under low measure light. Insets are magnified traces from the boxed area. B–E, Chl fluorescence induction traces of C. sorokiniana C3 on 0 d, 0.5 d, 2 d and 8 d respectively. Measurements were performed in darkness at room temperature and saturation pulses were applied every 30 s. Data are shown as the means ± SD (n = 3).

