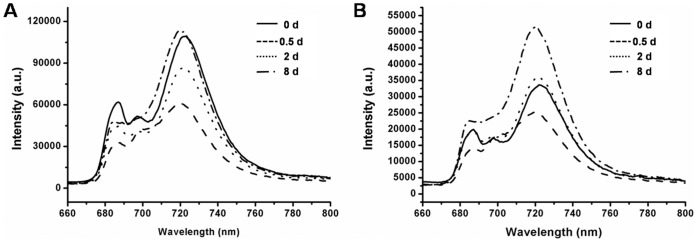
Figure 7. 77K fluorescence of thylakoid membranes of C. sorokiniana C3 during OD formation.

Fluorescence emission spectra of thylakoid membranes of C. sorokiniana C3 under N starvation for 0 d, 0.5 d, 2 d and 8 d. Excitation wavelengths were: 435 nm (A), 480 nm (B). After dark adaptation, cells were frozen and the spectra were recorded at 77K. All samples correspond to 15 µg ml−1 Chl.
