
Figure 1.
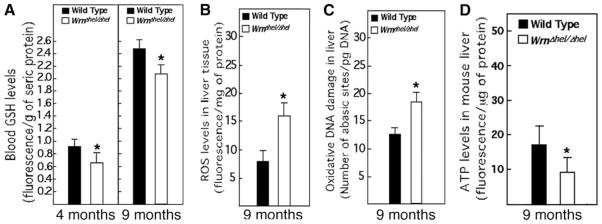
Blood GSH levels and oxidative stress in WT and WrnΔhel/Δhel mice. A) Blood ascorbate level in 4- and 9-mo-old mice; n = 6 for each cohort and measurement. B) Liver ROS levels in 9-mo-old mice; n = 10 (5 females, 5 males) for each cohort and measurement. C) Oxidative DNA damage levels in liver of 9-mo-old mice; n = 10 (5 females, 5 males) for each cohort and measurement. D) ATP levels in liver tissues of 9-mo-old WT and WrnΔhel/Δhel mice; n = 6 for each cohort and measurement. Bars represent means ± SE. *P < 0.05 vs. WT; unpaired Student’s t test.