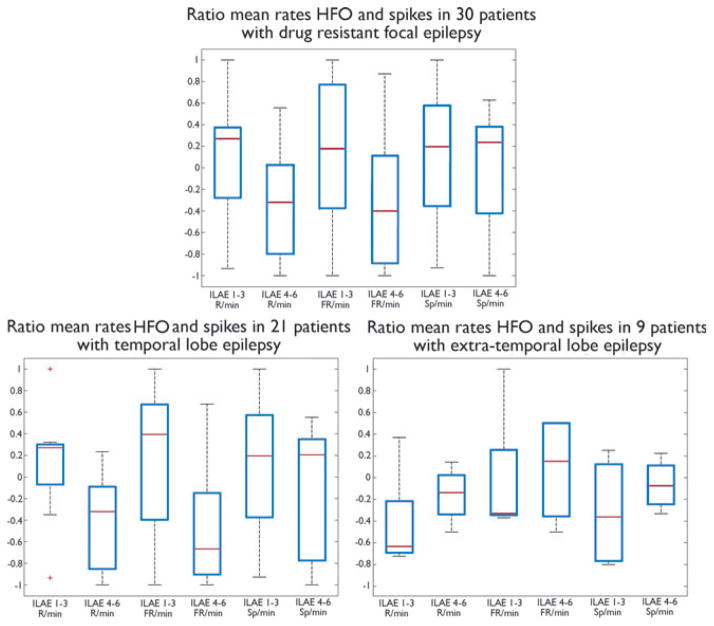
Figure 3.
Boxplots illustrating ratios between HFOs in removed and nonremoved contacts for patients with a favorable surgical outcome (ILAE classes 1–3) and those with a poor outcome (ILAE classes 4–6), in the entire cohort (graph at the top) and in the TLE and ETLE subgroups (graphs at the bottom). Note that the results in the entire cohort are influenced mainly by the TLE subgroup, which is more than twice as large as the ETLE subgroup (21 vs. 9 patients). Symbol (*) indicates statistically significant differences. R, ripples; FR, fast ripples.
Epilepsia © ILAE

