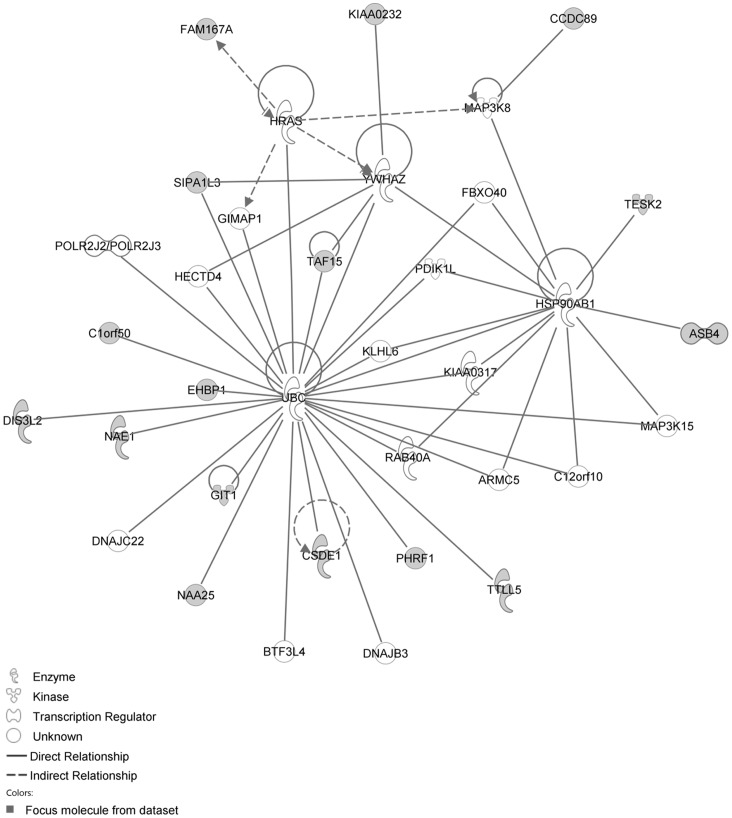
Figure 3. IPA network showing the network with the largest number of up-regulated focus genes in the MCA of the hypertension only group, compared with sham operated controls.
Nodes are displayed using various shapes that represent functional classes of gene products. Focus genes in this network are indicated in grey nodes. Solid and dotted lines indicate direct and indirect interactions, respectively.

