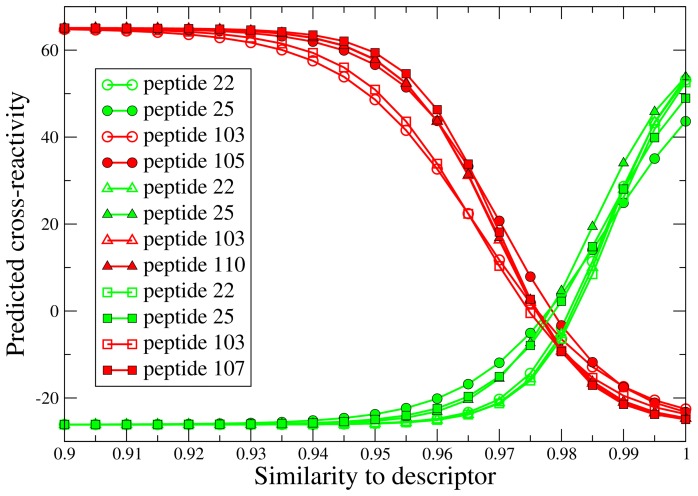
Figure 6. Predicted cross-reactivity as a function of the similarity to the different descriptors in the three models obtained for the entire data set (23 molecules).
The three different models are indicated by circles, triangles and squares, respectively. The descriptors are colored according to cross-reactivity: cross-reactive descriptors, i.e. peptides 22 and 25, are colored green and non-cross-reactive descriptors, i.e. peptides 103 and 105/107/110, are colored red. It can be observed that an increased similarity to the cross-reactive peptides increases the predicted cross-reactivity, while an increase in similarity to one of the non-cross-reactive peptides decreases the predicted cross-reactivity.

