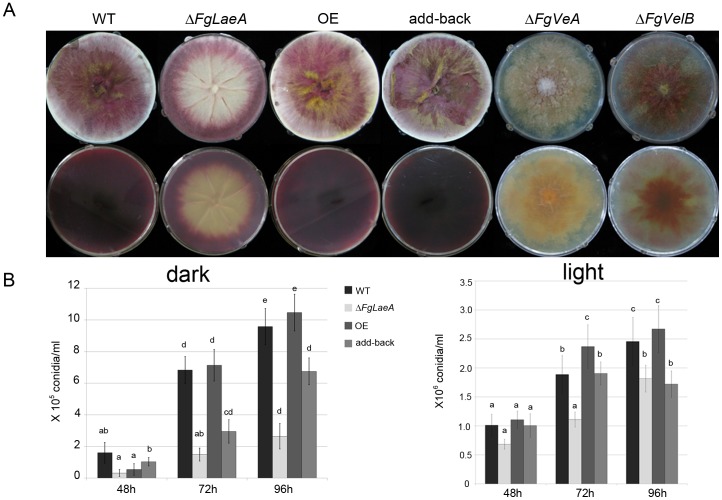
Figure 2. Hyphal growth, pigmentation, and conidiation.
(A) Colony morphology of the WT (Z3643), ΔFgLaeA, OE (FgLaeA-overexpression), add-back, ΔFgVeA [32], and ΔFgVelB [33] strains on CM plates. Upper and lower panels show the morphology in surface and undersurface of plates, respectively. (B) The number of conidia formed in CMC liquid medium under dark and light conditions. The y-axis represents the number of conidia (×105 or ×106/mL). Data shown are the mean values obtained from three independent samples. Statistical analysis was performed with ANOVA and Duncan’s multiple range test. The same letter above bars represents no significant difference.

