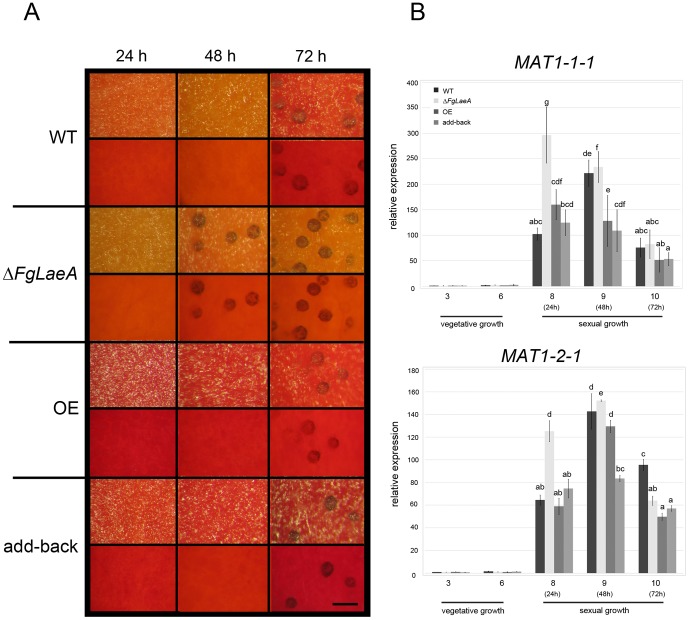
Figure 3. Protoperithecia formation and the expression of MAT genes.
(A) Protoperithecia formation on carrot agar in the WT (Z3643), ΔFgLaeA, OE (FgLaeA-overexpression), and add-back strains. Time since perithecia induction (i.e., the removal of aerial mycelia, which had previously grown for 7 days in the dark) is indicated above the pictures. Upper and lower panels for each strain show the surface and undersurface, respectively, of carrot agar plates. The size bar indicates 200 µm. (B) Relative transcript levels for two MAT genes (x-axis) accumulated in the fungal strains shown in (A) at each of the growth time points (days, y-axis) for total RNA extraction. 3 and 6: days 3 and 6 under vegetative growth, respectively; 8, 9, and 10: days 8, 9, and 10 following perithecial induction, respectively (i.e. 24 h, 48 h, and 72 h after perithecia induction, respectively). GzRPS16 (FGSG_09438.3) was used as an endogenous control for data normalization [52]. MAT1-1-1 and MAT1-2-1 transcript levels from a 3-day-old vegetative sample of a F. graminearum WT strain were used as references. Statistical analysis was performed with ANOVA and Duncan’s multiple range test. The same letter above bars represents no significant difference.

