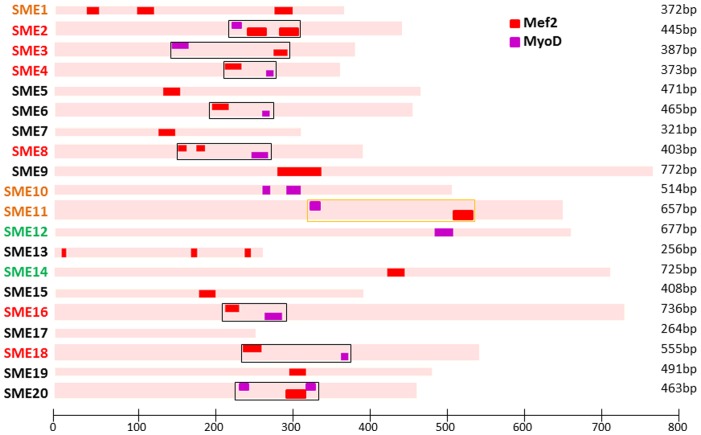
Figure 4. TFBS analysis.
Top 20 predicted SMEs were examined for the presence of Mef2 and MyoD clusters. We found clusters of >2 Mef2/MyoD sites over regions >200 bp in all 6 SMEs shown to drive muscle expression in combination with γ-cry promoter (red) and 1/3 of the additional 3 enhancers that were found to drive muscle expression in combination with krt8 promoter only (orange). Two of the negative elements also displayed this cluster (SME6/SME20), but none of the enhancers found to express in tissues other than muscle (green).

