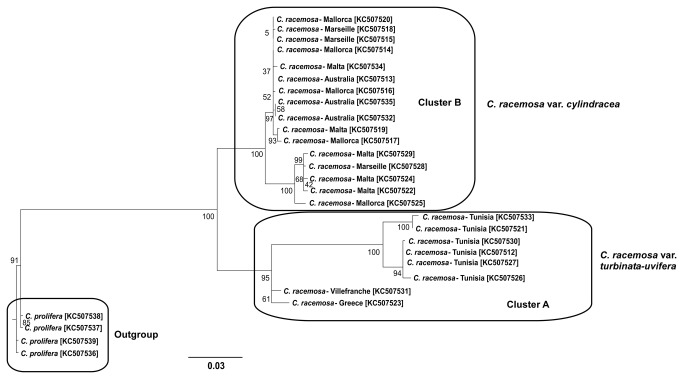
Figure 3. Maximum Likelihood tree from C. racemosa ITS calculated using the evolution Model TPM2+G with bootstraps calculated after 1000 replicates.
Alignments of each cluster were BLAST against Genebank nucleotide database and got the highest hits with sequences from Verlaque et al. 2003 study [AY334305-Cluster A and AY173118-Cluster B] C. prolifera samples from Mallorca were used as outgroup. Genbank accession numbers are represented within brackets.

