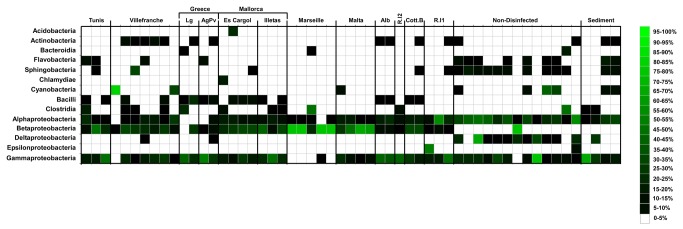
Figure 4. Heatmap representing distribution of the main classes among samples.

Scale bar represents the percentage of sequences belonging to the OTUs represented in the heatmap.

Scale bar represents the percentage of sequences belonging to the OTUs represented in the heatmap.