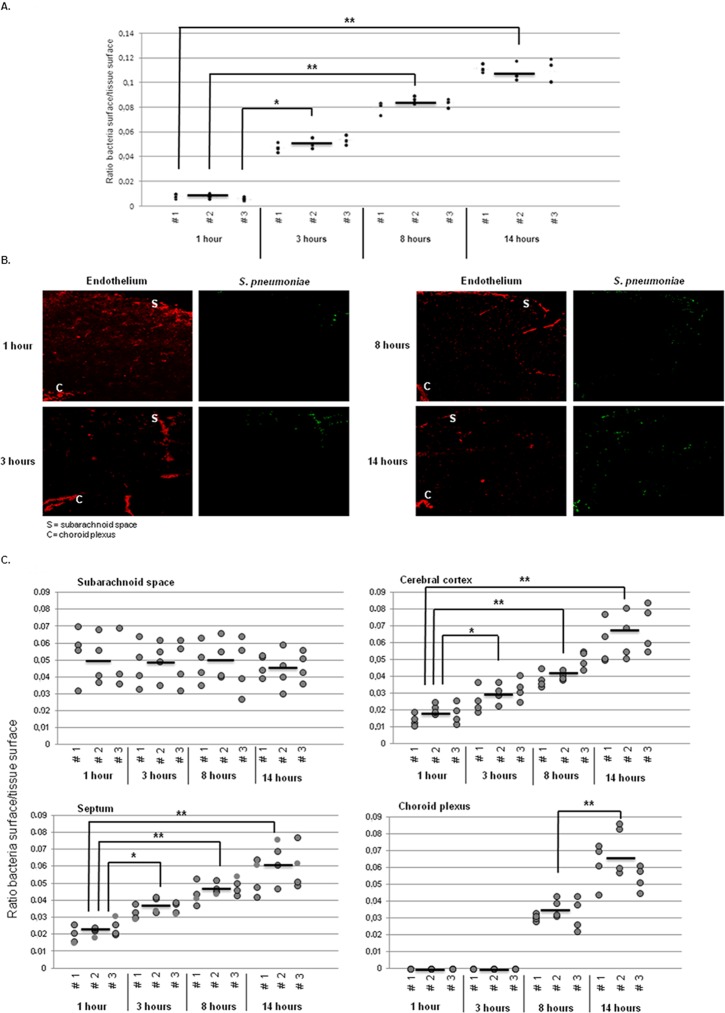
Figure 2. Spatiotemporal distribution of S. pneumoniae in the brain.
A. Quantification of the amount of pneumococci in the brain over the time course of infection using the fluorescent signal of the secondary antibody with which the bacteria were detected. For each time point, the average signal in 9 brain sections per mouse was calculated and with the 3 averages from 3 mice, the overall average was calculated, represented as an a bold bar. In the graph, each black dot is the average value of 1 slide/mouse and each number (#1, 2, 3) represents one mouse. The ratio of bacteria in mock tissue was 0. * indicates p<0.05, ** indicates p<0.01. B. Brain slides of mice challenged with S. pneumoniae were stained for vasculature using tomato lectin (red) and bacteria (green) as described in Material and Methods. Total magnification 50X. These images are representative of the situation in i) each brain compartment during all the time points of infection, and ii) each mouse that was analyzed. C. Quantification of pneumococci using the fluorescent signal of the bacteria measured in the brain over the time course of infection. For each time point, the average signal in 4 brain sections per mouse was calculated and with the 3 averages from 3 mice, the overall average was calculated, represented as a black line. In the graphs, each gray dot is the value of 1 section/mouse and each number (#1, 2, 3) represents one mouse. The ratio of bacteria in mock tissue was 0. * indicates p<0.05, ** indicates p<0.01.

