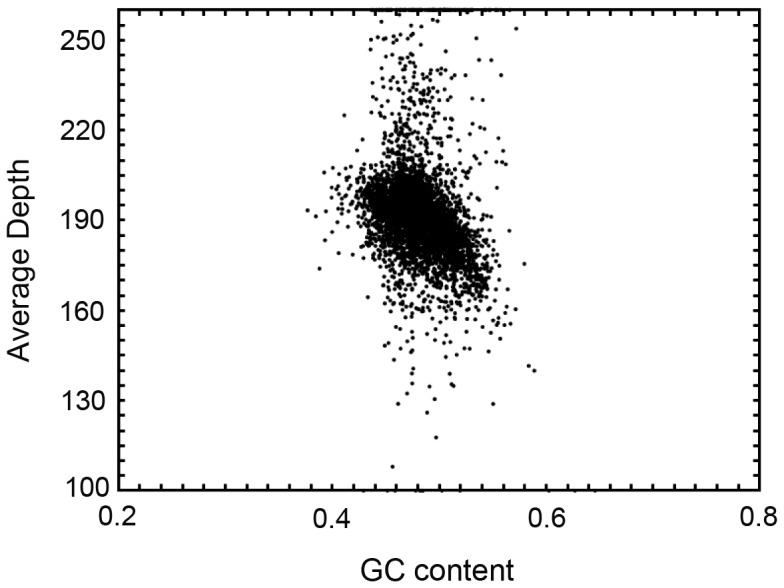
Figure 1. GC content and average sequencing depth of the genome data used for assembly.

(The x-axis was GC content percent across every 10-kb non-overlapping sliding window).

(The x-axis was GC content percent across every 10-kb non-overlapping sliding window).