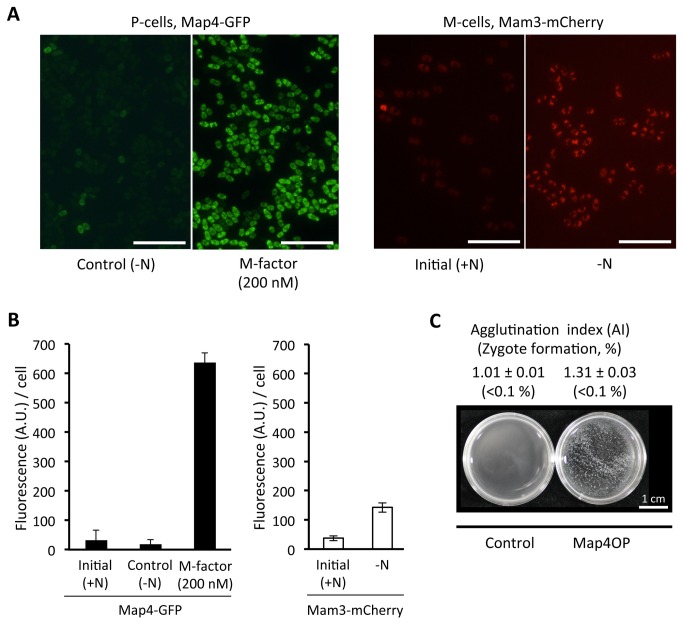
Figure 3. Expression of mating-type-specific adhesin proteins, Map4 and Mam3 (A, left).
A heterothallic h + strain (FS103) carrying a map4-GFP fusion gene integrated at the authentic chromosomal locus was precultured in SSL+N for 18 hr, then shifted to SSL−N with or without 200 nM of M-factor, and cultured for 4 hr. (A, right) A heterothallic h − mam2Δ strain (SS1463) carrying a mam3-mCherry fusion gene integrated at the original chromosomal locus was incubated for 4 hr in SSL−N (−N). Scale bar, 50 µm. (B) Quantification of Map4-GFP and Mam3-mCherry fluorescence. The intensity was quantified by image analysis using Image-J software. At least 8 different areas were analyzed. Means of arbitrary units (A.U.) with standard deviations are presented. (C) Induced agglutination by overexpression of Map4. Strain SS1290 ectopically overexpressing map4 + driven by the nmt1 promoter was precultured in MM+N without thiamine for 12 hr and then cultured in MM−N for 4 hr (Map4OP). The same strain was transformed by the pSLF173 empty vector [43] as a control.

