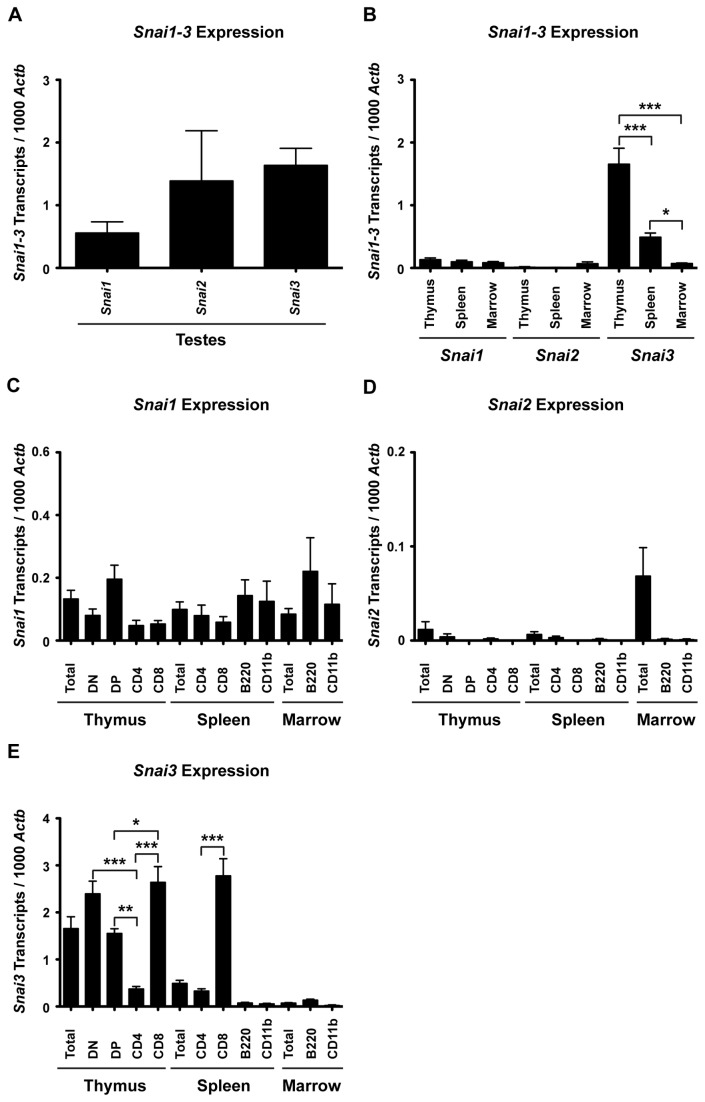
Figure 2. Snai1-3 transcripts are differentially expressed in primary and secondary lymphoid organs of wild type mice.
RNA was isolated and cDNA synthesized as described in the Materials. Quantitative real-time RT-PCR was performed via LightCycler as described in the Materials. (A) cDNA from testes served as a positive control for all RT-PCR analysis. (B) Snai1-3 transcript analysis of cDNA generated from total thymus, spleen, and bone marrow. (C–E) RT-PCR of specific cell subsets demonstrating the distribution patterns of Snai1 (C), Snai2 (D), and Snai3 (E) expression. Three mice were analyzed for the testes. At least 4 mice were analyzed per immune cell type. Levels of Snai1-3 transcripts are relative to 1000 Actb transcripts per each individual sample. Data are represented by the mean ± SEM. One-way ANOVA with Bonferroni post hoc test: * p < 0.05, ** p < 0.01, *** p < 0.001.

