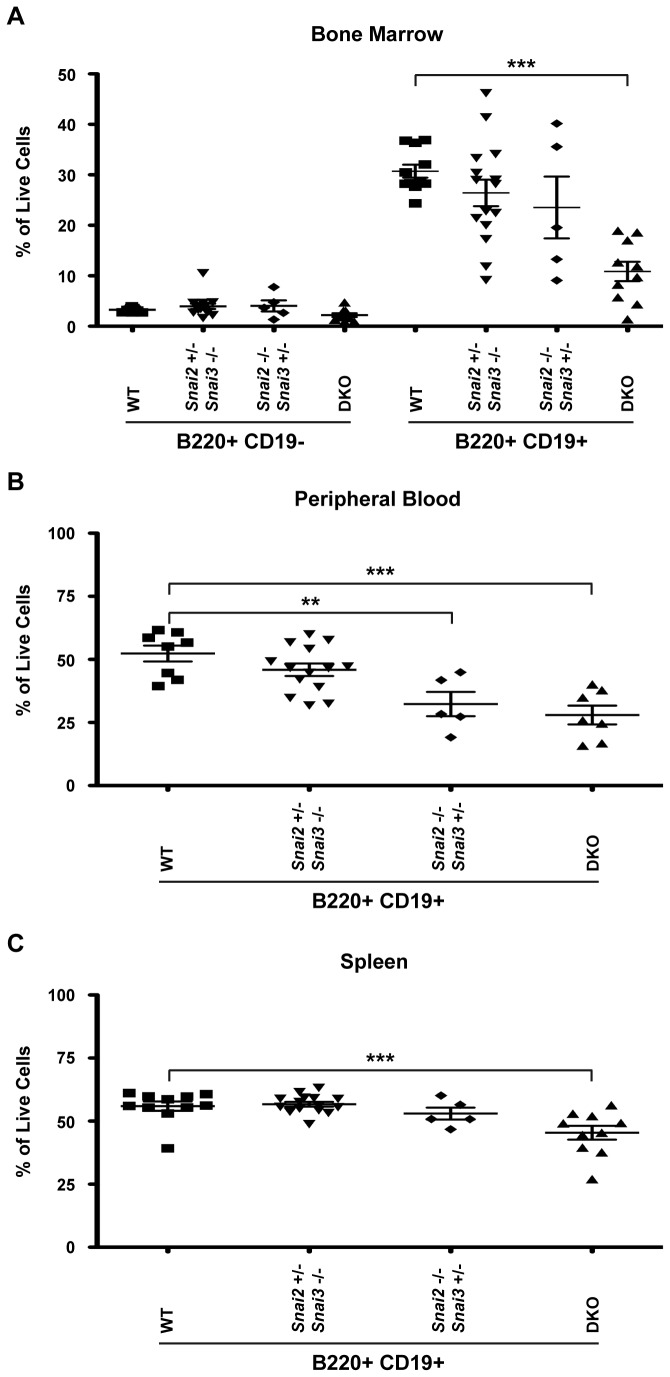
Figure 10. Snai2 and Snai3 DKO mice demonstrate a severe impairment in B cell development.
FACS analysis was performed to assess B cell populations in the bone marrow (A), peripheral blood (B), and spleen (C). B cell populations were assessed using surface staining for B220 and CD19. In the bone marrow (A), B220+CD19- (pre-pro-) and B220+CD19+ (pro-, pre-, immature, and mature re-circulating) cells were assayed. In the peripheral blood (B) and spleen (C), B cells were defined as B220+CD19+. Results are presented as a percentage of total cells analyzed. One-way ANOVA with Bonferroni post hoc test: ** p < 0.01, *** p < 0.001.

