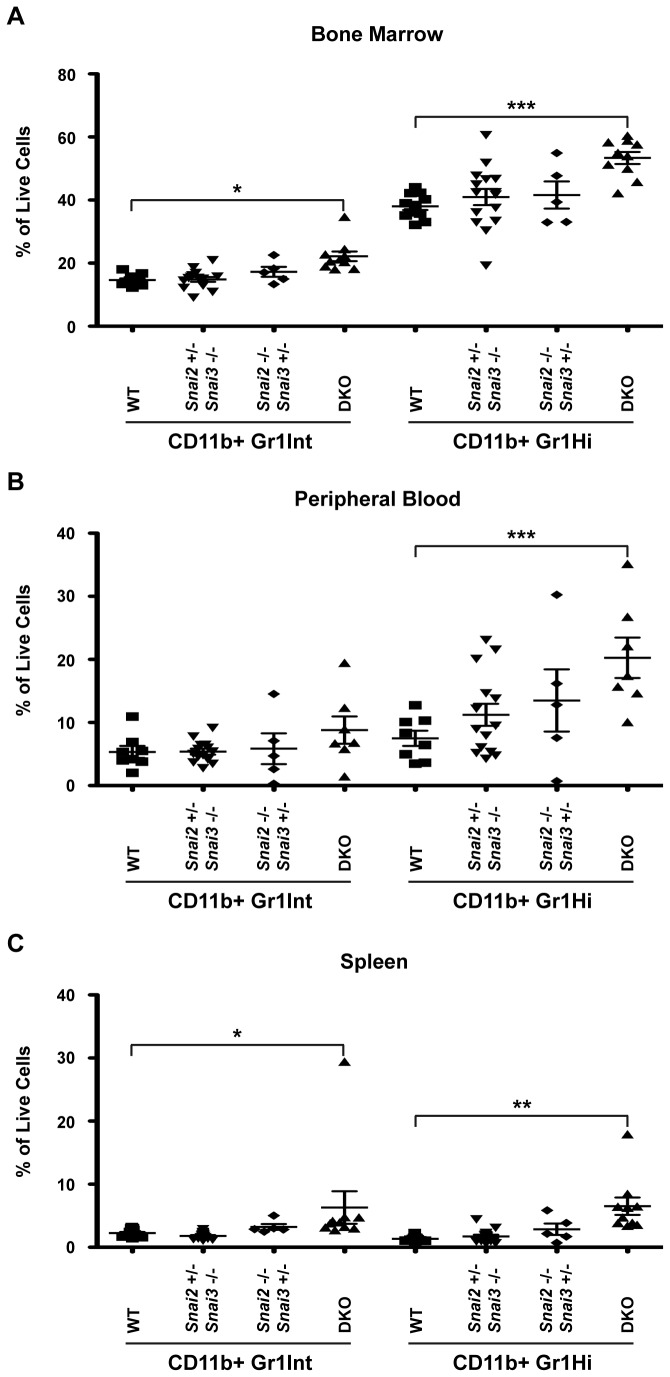
Figure 11. Myeloid populations are enhanced in the Snai2 and Snai3 DKO.
FACS analysis was performed to assess myeloid cell populations in the bone marrow (A), peripheral blood (B), and spleen (C). Cells were stained for CD11b and Gr1. Macrophages are identified by CD11b+ Gr1Int staining. Neutrophils (representative of granulocytes) are distinguished by CD11b+ Gr1Hi staining. Results are presented as a percentage of total cells analyzed. One-way ANOVA with Bonferroni post hoc test: * p < 0.05, ** p < 0.01, *** p < 0.001.

